Algorithm and Portfolio Stats: 04/29/2024 - 05/03/2024

We’re starting this month off with back to back negative return weeks on the algorithm. If you’d taken every position, allocated equally, targeting the 15.15% allocation per position we’re targeting here, you’d be down 0.72%. While this is within expectations for our projected Sharpe ratio, it’s a bit much. As such, we’re aggressively preparing back up systems, should this trend continue. Additionally, we feel that this performance does not accurately reflect the expected return seen by a user of this system, given that many of the losing trades recommended meet our hard requirements, but are more obviously flawed to a human trader (more on this later). Regardless, our goal is to improve our system until consistent returns can be made even following it blindly.
Before going into individual trades from the week, I’d like to take a moment to discuss the experimental systems we’ve got in the works, to give an idea of what we’re working on. These are simply denoted A-E.
System A. This is our longest-running experimental system at the moment, and it’s one we’ve discussed previously. It works fairly similarly to our public Day Trade Bot, but with some reworked requirements for which trades it takes and which ones it does not. So far, results have been relatively unimpressive, leading us to suspect that it’s over fit to the markets. I would be surprised if this one ever saw a public release.
System B. This one represents a foray into Machine Learning. It also utilizes our TK-cross strategy, using a random forest estimator. On this one, we’re taking the factors we usually consider when deciding whether to take a TK-cross play (e.g. momentum, MACD, RSI, lagging line, cloud positions, etc), and feeding them to a machine learning model.
The theory behind this one is two-fold. First, machine learning is useful, but it’s not a magic wand. You still have to hold the model’s hand, and kind of show it what it needs to look at (more formally, this process is called ‘feature engineering’). At the same time, skilled traders are good at knowing when a trade is good or bad to take, and which factors are useful to consider. However, human traders will have a hard time describing exactly which rules to apply to these factors.
If you don’t believe me, here’s an exercise you can do at home. The next time you’re trading, and you see a position you want to take, examine the chart and ask yourself, “Why do I like this trade? Why exactly?”. Maybe you’re also using TK-crosses, in which case your rule might be as simple as “Buy crossovers, sell crossunders”, but then consider: do you take every TK-cross? Maybe you only trade stronger crosses. But how do you measure the strength of a cross? The angle of the TK-lines seems like a good measure here, but how steep do you need the angle to be? What timeframe are you using to measure that angle? If the MACD is particularly strong, would you accept a shallower angle? What if the chart has been choppy that day? How choppy is too choppy to trade? How are you measuring that?
These seem like overly-specific questions, but when designing a trading algorithm, they all have to be considered. And I can assure you, it only gets harder when you’ve got someone like me looking over your shoulder and directly back-testing every rule you propose.
That’s where machine learning comes in. If a human trader knows what’s worth looking at, the model should (in theory) be able to deduce which exact patterns to look for.System C. This one does not use TK-lines, but instead it’s a more short-term mean-reverting strategy. The goal here is to launch this, simultaneously with one of our TK-traders. Since the TK-crossover strategy is inherently trend-following, it stands to fail during markets where mean reverters will do well. So by using a trend-follower in conjunction with a mean-reverter, we should be able to get much more consistent returns.
System D. This one is similar to System B, but with a more complex model. This one accounts for factors like choppiness which System B does not consider.
System E. A hybrid of B and C. This one uses a random forest estimator, on our mean reverting strategy.
If I had to guess, I would say that, eventually, we’ll launch some variation of System D and System E. Together, these will get us the benefits of feature-engineered machine learning, TK-crosses, and mean reversion. But we’ll give further updates on this when we have them.
Now then, let’s examine some of our winners and losers of the week.

Our best trade this week is this short on AMAT from Tuesday. We made 0.81% here across 2 entries. This is a golden trade right here. It hits all of our signs, with no real red flags. Momentum is solid, the cross is strong, both TK-lines slope downwards, MACD is solid and improving, and our lagging line is cooperative. Our re-entry doesn’t look as good, but since that trade ended almost completely in the black, you weren’t missing anything if you declined that one.

Our worst trade of the week was this long on CHRW, and it’s exactly what I mean when I say that this system’s biggest losers are usually obvious to human traders. This one lost 1.03% over the course of 5 entries. The MACD dies almost immediately after our first entry, making all of the re-entries immediately highly questionable. On top of that, the rapid rate of entries and exits are another obvious red flag.
While the loss here was easy to avoid or mitigate, it’s still unfortunate that something like this got alerted in the first place. We strive for future iterations to avoid trades like this, even if human traders know to avoid them.

The last trade from this week I want to highlight is this short on EFX, as an example of a much stronger re-entry. We made 0.81% here, entirely from our second entry here. The biggest red flag of this trade is that the MACD is relatively weak, but by the time our re-entry is signaled, it’s gotten stronger, in addition to the Tenkan-Sen line beginning to slope downwards, indicating a potential for a level break here.
This trade isn’t textbook, but it has a good amount of appeal to it. If you were watching the charts live, you had good cause to take it, including the re-entry.
Lastly, let’s look at our portfolio over the last week.


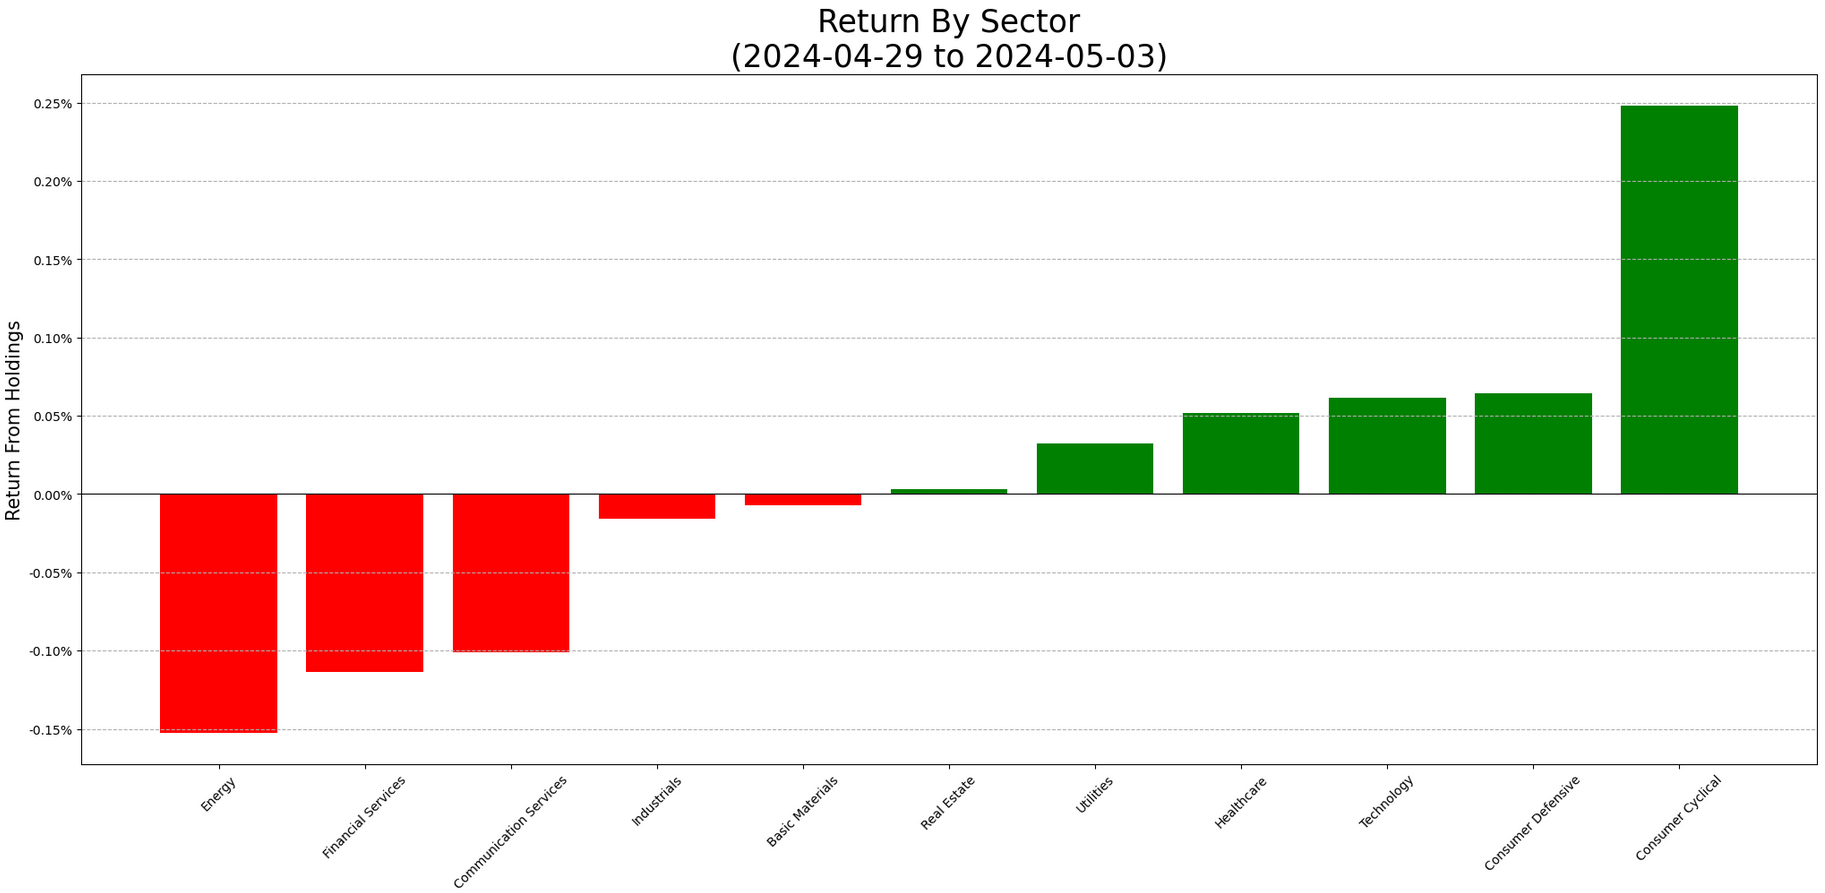
We finish this week just below SPY (+0.07% vs +0.2%), with tech only placing near the top. Our big winner for the week was Consumer Cyclical, carried by AMZN.


This week, we’re going significantly more aggressive. With tech making up nearly 40% of our portfolio, this is our heaviest tech portfolio so far. Our sector exposures back us up here, with our biggest over-exposures being to relatively speculative industries, and the market itself.
As always, the contents of our portfolio are below. For brevity, all tickers with allocations under 0.5% are excluded.

That’s all I have for you tonight. As always, thanks for reading - and happy trading!