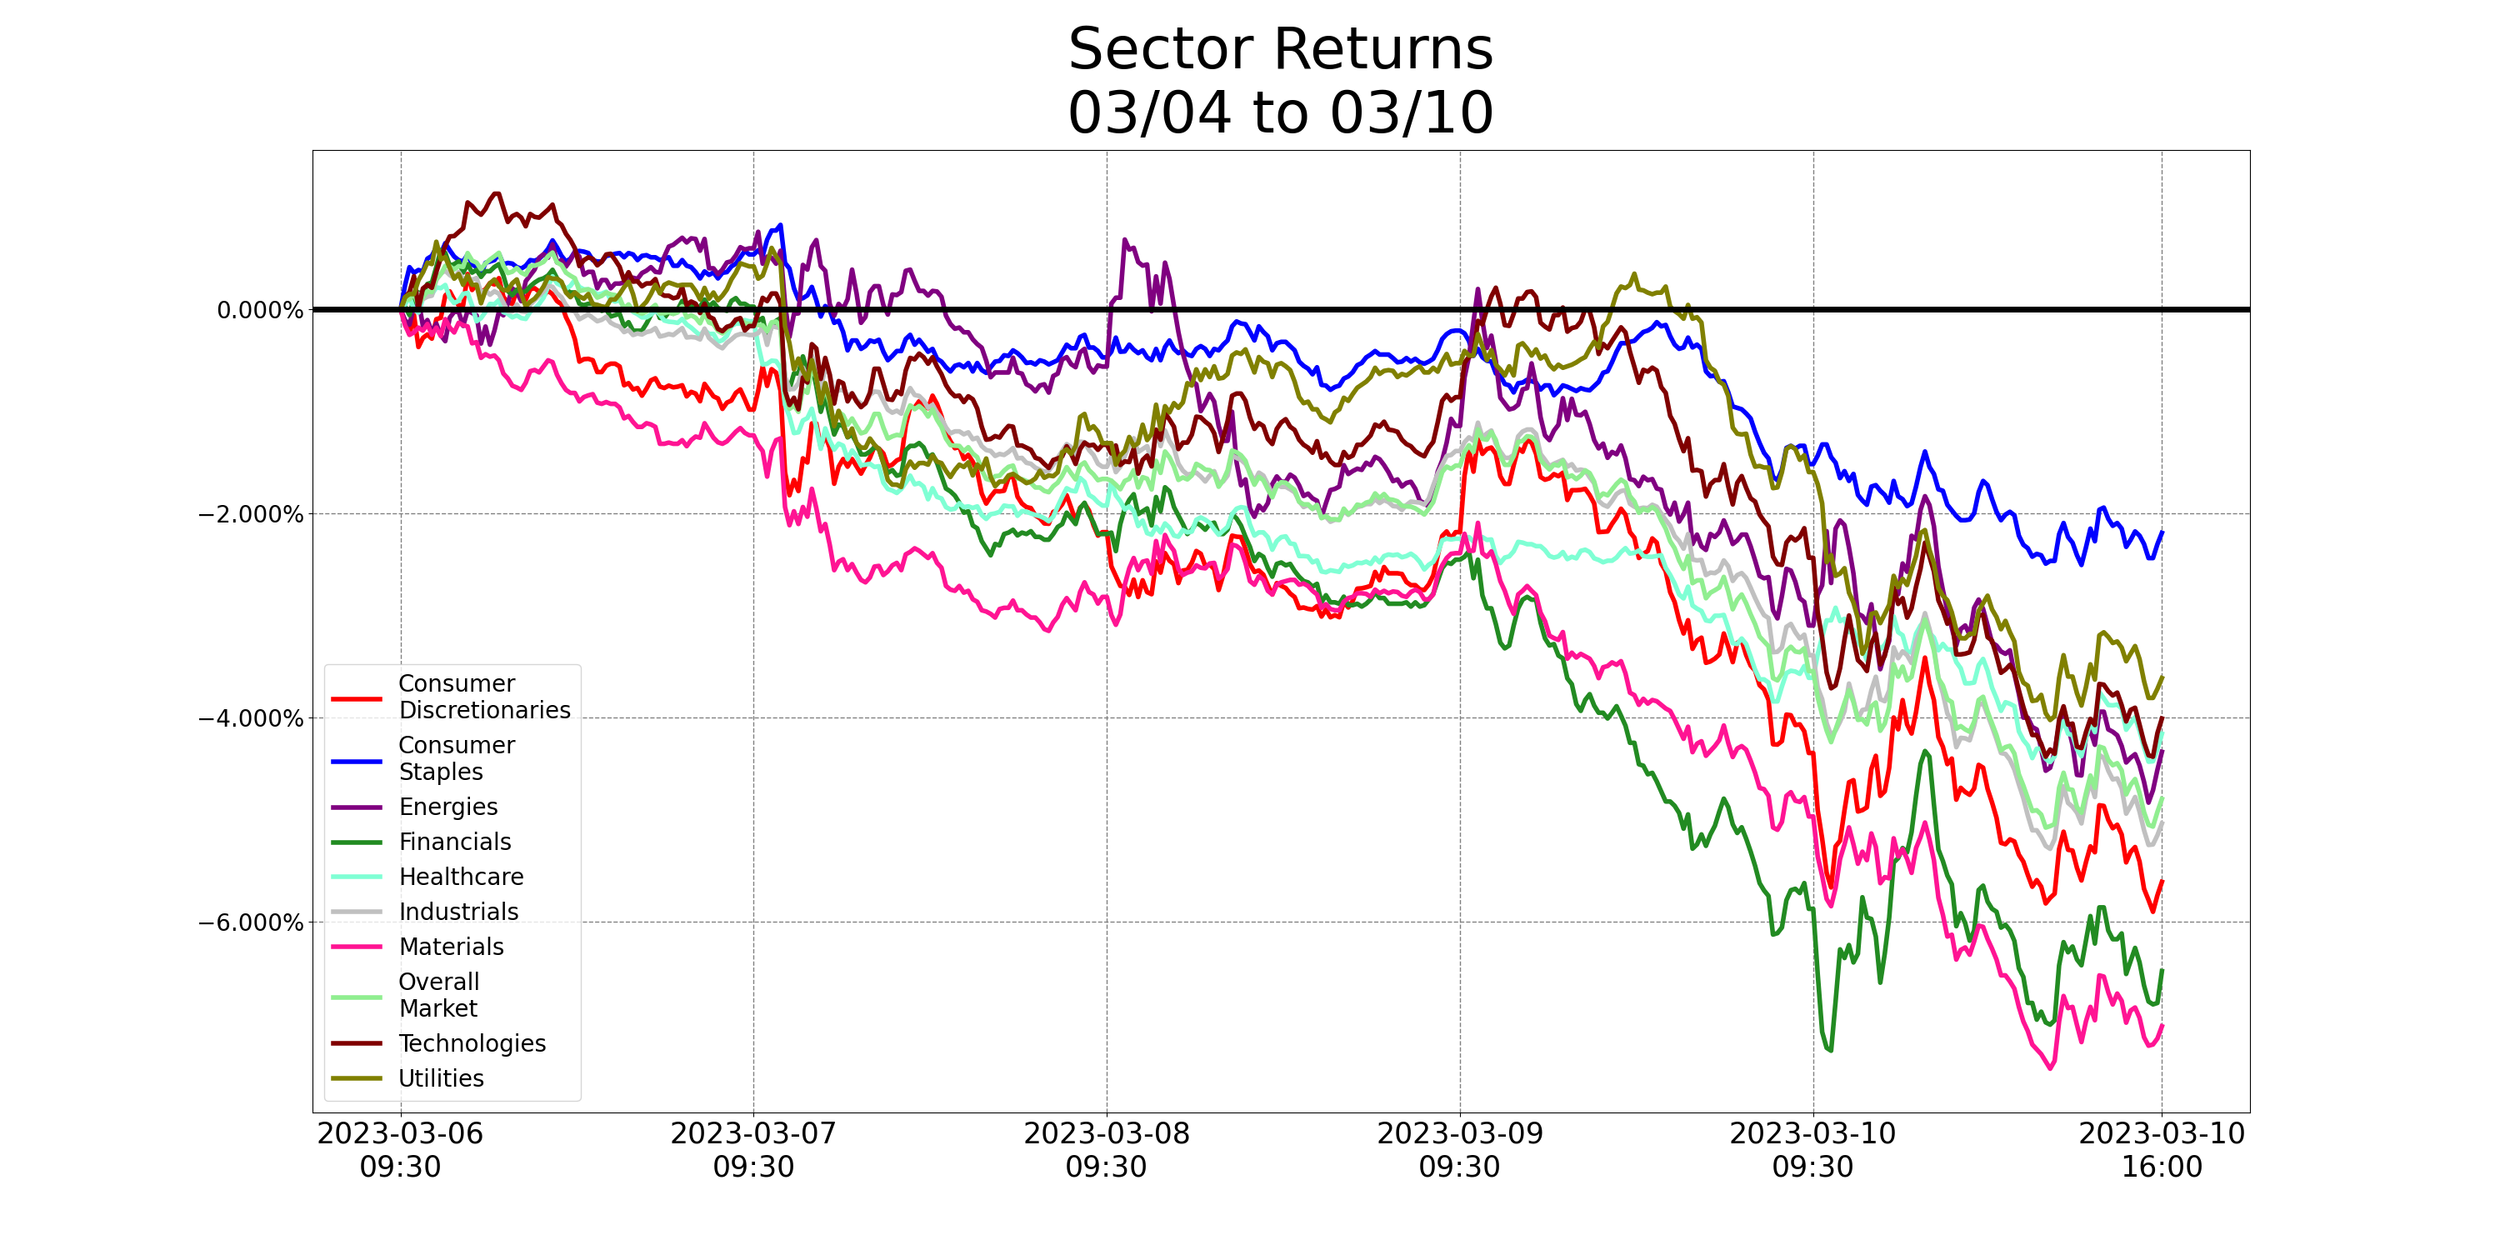
Weekly Algorithm Review: 03/04/2023 to 03/10/2023
Algorithm Performance This Week
Market Neutral: +0.3%
Sector Neutral: -0.22%
Variable Market Neutral: -1.64%
Variable Sector Neutral: -1.87%
Long Term Portfolio: -4.08%
Base Algorithm: -4.46%
Overall Market: -4.8%
Performance of the algorithm is slightly negative this week, relative to our long term portfolio - down by 38 bps. We’re still up on technicals over the last three weeks, but I do want to dig a little into what the algorithm has been doing lately.
Over the last month or so, the base algorithm has leaned more and more into technology - especially relative to our long term portfolio, which has barely touched it. In particular, it’s spent weeks holding large quantities of NVDA, sometimes putting more than 20% of its portfolio into it.
This move has been a net positive for us, since over that timeframe, NVDA has outperformed both the long term portfolio and the overall market, but it’s something we’re staying cognizant of. We’re in the process of choosing a new broker for the pilot account, and not trading on the algorithm these days. If we were, I would suggest reducing the allocation of NVDA. I try not to interfere with the algorithm, but with allocations distributed like this, I feel some is necessary.
The second reason I’d be cautious of the algo’s ongoing NVDA play is that it largely goes against the philosophy of our long term portfolio. NVDA has a market beta of about 1.75. Our long term portfolio has been selected for defensive play, and with the state of the market this week, I’m more inclined than usual to agree with that stance.
As always, this is not financial advice. But when trading, it’s important to consider your own risk tolerances, as well as your stance on the market’s future. If you think it’s time for a market crash, you’re probably not looking to increase your portfolio’s market beta.
All in all, I’m still happy with the algorithm’s performance. Technicals have remained a net positive for us in the face of a market deeply uncertain about where it wants to go. But the algorithm doesn’t turn on a dime. It usually takes some time to determine if a sudden change in the market is a one-off incident, or a change in long-term outlooks.
The next 1-2 weeks will not be ones I’m comfortable fully trusting the algorithm. I’m personally looking to play safe, and might lean more on the market neutral algorithm.
What’s In The Pipeline?
The HK Screener is fully launched! For now, it only broadcasts strong Ichimoku signals. Over time, we’ll be looking to expand it to include other signals we feel strongly about. If you have a favorite technical signal - let us know! Maybe you’ll get an alert system just for that signal.
We’re looking to make 2 improvements to the grapher. First, we’re working on an integrated AI-powered chatbot. At this time, live analysis will not be possible, but it will be able to reply using our grapher. We’re testing it among HK staff right now, and results have been promising. Should they remain this way, expect it to become available to users. Consider the following graph:
In order to get this, which message would you rather send:
/incomestatement ticker:aapl, lookback:10, field1:revenue, field2:costOfRevenue, field3:grossProfit, field4:generalAndAdministrativeExpenses, field5:netIncome, regressionLookBack:3, regressionLookAhead:2
@TradeBot What’re Apple’s income statements like? Give me 10 years history, and forecast the next 2
We’re also looking to create a web page for our graphing system, in order to make it more widely available, though this is likely further out.
Misc. Data For The Week


