Triple Bottom Pattern: A Bullish Reversal Chart Pattern
The triple bottom pattern is a bullish reversal chart pattern that occurs at the end of a downtrend. It indicates that the sellers have tried to push the price lower three times but failed to break the support level. The pattern is confirmed when the price breaks above the resistance neckline, signaling a trend reversal and a bullish trend.
In this article, we will explain what the triple bottom pattern is, how to trade it, and how to differentiate it from the triple top pattern.
What is a Triple Bottom Pattern?
When an instrument’s price hits the same or similar low point three times in a row, it forms a triple bottom pattern. The pattern consists of three failed attempts to break the support line at the same price level and then a breakout above the resistance neckline. The support line is also called the valley or the bottom, while the resistance line is also called the peak or the neckline.
The triple bottom pattern shows that the sellers are losing strength and the buyers are gaining momentum. The pattern suggests that the downtrend is over, and a new uptrend is about to begin.
Is the Triple Bottom Bullish or Bearish?
The triple bottom is a bullish chart pattern that signals a change in the trend direction from bearish to bullish.
The pattern shows that the buyers have taken control of the price action from the sellers after three unsuccessful attempts to break the support level.
Triple Bottom Pattern Example
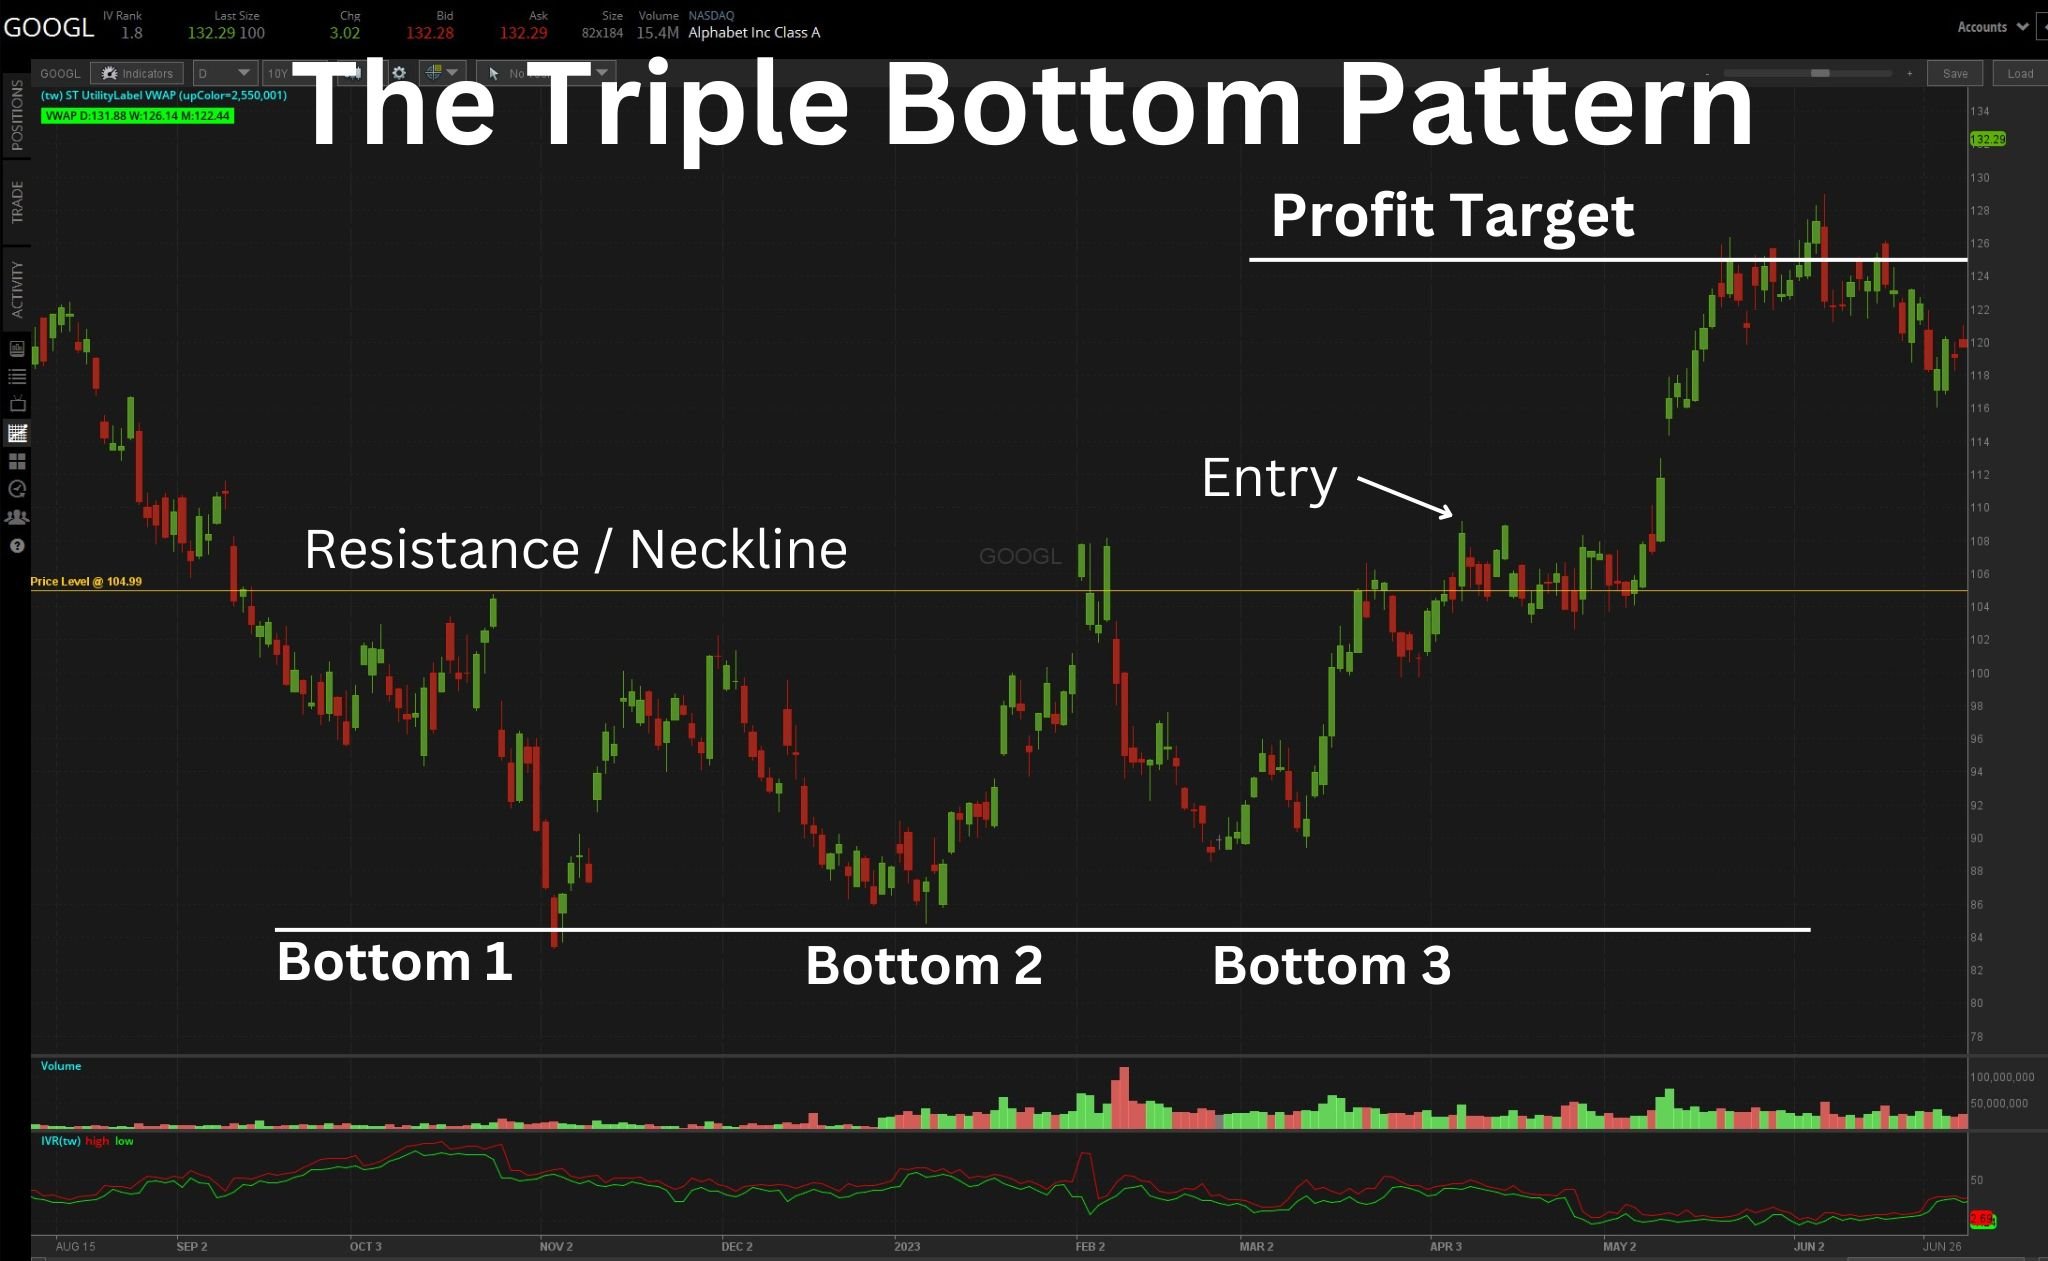
Triple Bottom Pattern on tastytrade
Let’s look at an example of a triple bottom pattern using Google’s stock (GOOGL) as an example. The chart below shows the daily price action of GOOGL from November 2022 to May 2023.
As you can see, GOOGL was in a downtrend from November 2022 to March 2023, forming lower highs and lower lows. However, in March 2023, the price bounced off the support level for the third time, forming a triple bottom pattern.
The resistance neckline was formed by connecting the highs in October, February, and March around 105.
The pattern was confirmed on April 6, 2023, when GOOGL broke above the neckline with a strong bullish candle and increased volume. This indicated that the buyers had overcome the sellers, and a new uptrend had started.
How to Trade the Triple Bottom Stocks Pattern
Trading the triple bottom pattern involves identifying the pattern, entering a long position when the breakout occurs, setting a stop-loss below the neckline or the support level, and setting a take-profit based on the measured move technique.
When to Enter the Triple Bottom Pattern Trade?
You enter a long position when the price breaks above the resistance neckline with a strong bullish candle and increased volume. This signals that the buyers have taken over, and a new uptrend has begun.
For example, in our GOOGL example, you could enter a long position on April 6, 2023, when GOOGL closed above $105 with a large green candle and high volume.
When to Exit the Triple Bottom Pattern Trade?
You exit your long position when you reach your price target or when you see signs of reversal or weakness in the uptrend.
To calculate your price target, you can use the measured move technique. This involves measuring the height of the pattern (the distance between the support level and the neckline) and adding it to the breakout point. This gives you an estimate of how far the price can move after breaking out of the pattern.
For example, in our GOOGL example, you could calculate your price target as follows:
Height of pattern = $105 - $85 = $20
Breakout point = $105
Price target = $105 + $20 = $125
Therefore, your price target in our GOOGL example is $125. You could exit your long position when GOOGL reaches this level or close to it, which happened in June 2023.
Alternatively, you could exit your long position when you see signs of reversal or weakness in the uptrend, such as lower highs and lower lows, bearish candlestick patterns, or negative divergence with indicators.
Triple Bottom vs. Triple Top Pattern
The triple bottom pattern is bullish, while the triple top pattern is bearish. The triple top pattern is the opposite of the triple bottom pattern. It is formed when an instrument’s price records three consecutive highs at approximately the same level.
The triple bottom pattern consists of three failed attempts to break the resistance line at the same price level and then a breakdown below the support neckline. The pattern indicates that the buyers have tried to push the price higher three times but failed to overcome the sellers. The pattern is confirmed when the price breaks below the support neckline, signaling a trend reversal and a bearish trend.
The main differences between the triple bottom and the triple top patterns are:
The triple bottom is bullish, while the triple top is bearish.
The triple bottom is formed at the end of a downtrend, while the triple top is formed at the end of an uptrend.
The triple bottom consists of three lows at the same level and a breakout above the neckline, while the triple top consists of three highs at the same level and a breakdown below the neckline.
The triple bottom signals a change in trend direction from bearish to bullish, while the triple top signals a change in trend direction from bullish to bearish.
Bottom Line
Trading the triple bottom pattern involves identifying the pattern, entering a long position when the breakout occurs, setting a stop-loss below the neckline or the support level, and setting a take-profit based on the measured move technique.
If you want to learn more about technical analysis and becoming a profitable trader, join the HaiKhuu Trading community today. You will get access to exclusive content, live trading sessions, mentorship, and more. Don’t miss this opportunity to take your trading skills to the next level. Join now!

FAQ
What happens after the triple bottom pattern?
After a triple bottom pattern, the price usually breaks above the resistance neckline and starts a new uptrend.
Is a triple bottom better than a double bottom?
A triple bottom is not necessarily better than a double bottom, but it is more rare and more reliable. A triple bottom requires one more low to form, which means that the sellers have tried harder to push the price lower but failed. This makes the support level stronger and the reversal more likely.