The Triple Top Stock Pattern Explained
The triple top stock pattern is one of the easiest chart patterns to spot in technical analysis. It indicates that the price of an asset is likely to reverse its uptrend off a previous resistance and start a downtrend.
In this article, we will explain what the triple top pattern is, how to trade it, and some real examples of this pattern in action.
What is the Triple Top Chart Pattern?
The triple top chart pattern occurs when the price of an asset reaches a similar high point three times, with declines in between. The area of the peaks is called the resistance level, and the area of the pullbacks is called the support level.
The pattern shows that the buyers are unable to push the price above the resistance level, despite multiple attempts. This means that the buying pressure is weakening, and the selling pressure is increasing.
The triple top pattern is considered complete when the price breaks below the support level, confirming that the uptrend is over and a new downtrend has begun. The pattern can be measured by taking the height of the pattern (the distance between the resistance and support levels) and subtracting it from the breakout point (the lowest point of the support level). This gives an estimate of how far the price may fall after the pattern completion. The opposite of the triple top is the triple bottom pattern.
What is the Best Timeframe for Trading the Stock Triple Top Pattern?
The triple top pattern can occur on any timeframe, from intraday charts to weekly or monthly charts. However, the most common timeframe for trading this pattern is on the daily chart, as it provides a clear view of the price action and enough data points to confirm the validity of the pattern.
The triple top pattern can also be used for day trading on shorter timeframes, such as one-minute or five-minute charts. However, traders should be aware that these patterns may be less reliable and more prone to false breakouts or whipsaws. Therefore, traders should use additional indicators or tools, such as the volume profile or the Ichimoku clouds, to confirm the strength and direction of the breakout.
Is the Triple Top Bullish or Bearish?
The triple top stock pattern is a bearish pattern, as it signals that the price of an asset is likely to fall after completing the pattern. The pattern shows that buyers are losing control of the market, and sellers are taking over. The price may bounce back from the support level several times before breaking down, but each bounce becomes weaker and less convincing.
However, not all triple tops end up breaking down. Some triple tops may end up breaking out to the upside, invalidating the pattern and indicating a continuation of the uptrend. This may happen when there is a strong bullish catalyst or news that drives up demand for the asset. Therefore, traders should wait for confirmation of the breakout before entering a trade based on this pattern.
How to Trade the Triple Top in Stocks
There are two main ways to trade the triple top stock pattern: shorting or going long.
Shorting
Shorting is suitable for bearish patterns like the triple top, as it allows you to profit from falling prices.
To short a triple top stock pattern, you can follow these steps:
Identify a potential triple top pattern on a chart, with three peaks near a resistance level and two pullbacks near a support level.
Wait for confirmation of a breakdown below the support level on high volume.
Enter a short position at or slightly below the support level.
Place a stop-loss order above the resistance level or above the highest peak.
Set a target based on the height of the pattern subtracted from the breakout point.
Exit trade when the target is reached or when stop-loss order is triggered.
Alternatively, you can try to get in early on the triple top by shorting on the third peak and setting a stop loss above the peak and resistance. However, this means you are getting in early before confirmation.
Going Long
Going long is suitable for contrarian traders who do not believe that the triple top stock pattern will play out and instead anticipate a breakout to the upside.
To go long on a triple top stock pattern, you can follow these steps:
Identify a potential triple top pattern on a chart, with three peaks near a resistance level and two pullbacks near a support level.
Wait for confirmation of a breakout above the resistance level on high volume.
Enter a long position at or slightly above the resistance level.
Place a stop-loss order below the support level, the previous resistance level, or below the lowest pullback.
Set a target based on the height of the pattern added to the breakout point.
Exit the trade when the target is reached or when stop-loss order is triggered.
Real Examples of the Triple Top Pattern
Here are two real examples of the triple top stock pattern on the daily charts of the gold spot price (GLD) and Bruker Corporation (BRKR).
GLD Triple Top Example

GLD Triple Top on tastytrade
The chart above shows a triple top pattern that formed on GLD in January 2018. The price created three peaks near the $129.17 resistance level, with two pullbacks near the $125 support level.
The pattern was completed when the price broke below the support level on April 30, 2018. A short trader could have entered a short position at $124.40, with a stop-loss above $129.17 and a target at $119.40 ($124.40 - $5). The target was reached in June where the trader could set a stop loss in guaranteed profit or close the trade.
BRKR Triple Top Example
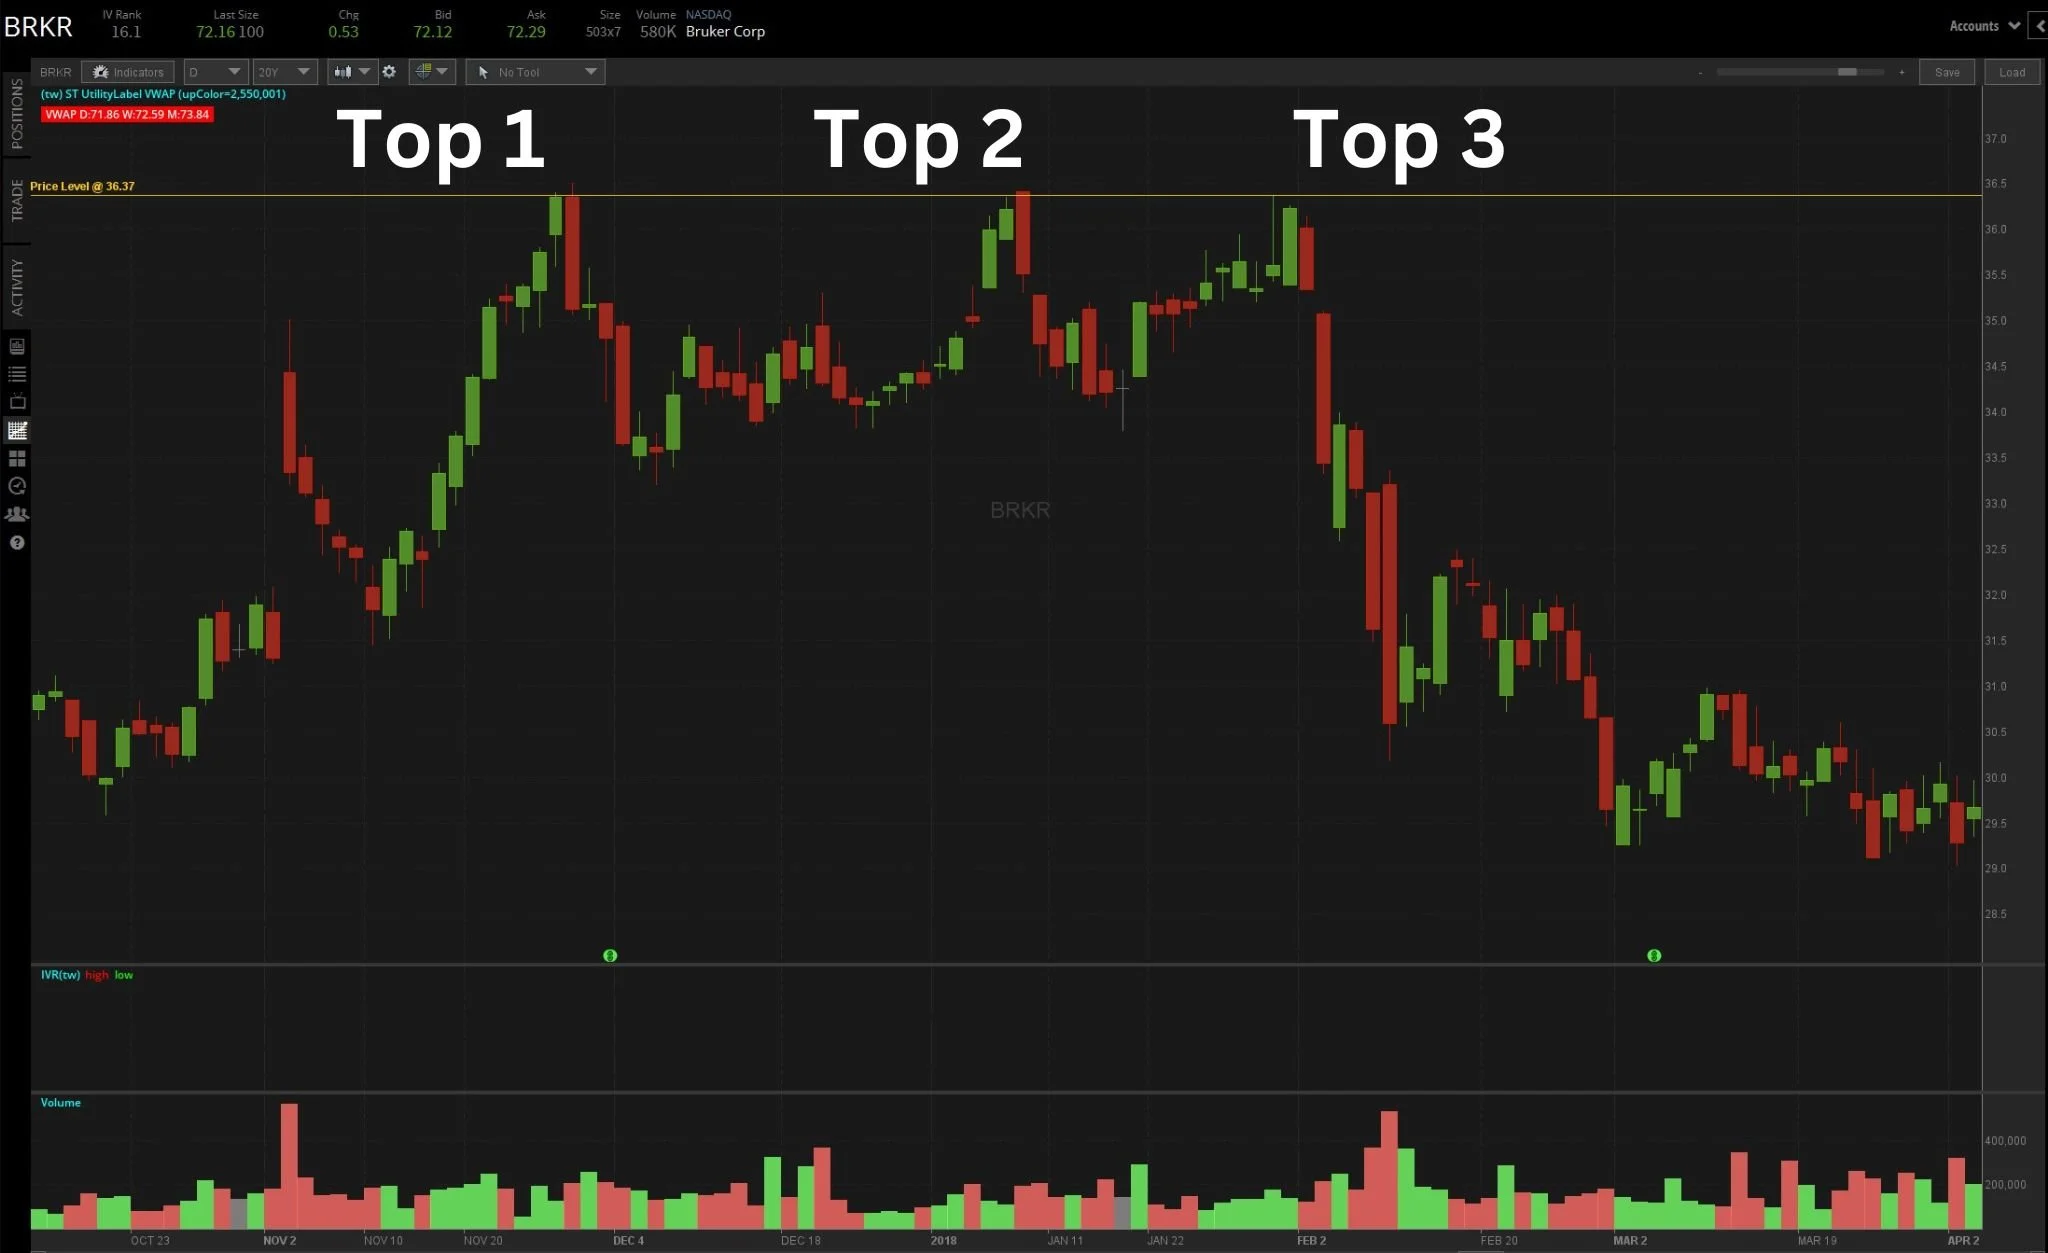
BRKR Triple Top on tastytrade
The chart above shows a triple top pattern that formed on BRKR from November 2017 to February 2018. The price created three peaks near the $36.37 resistance level, with two pullbacks near the $33 support level.
The pattern was completed when the price broke below the support level on February 6, 2018, on high volume. A short trader could have entered a short position at $33, with a stop-loss above $36 and a target at $30 ($33 - $3). The target was reached on March 1, 2018, resulting in a profitable trade.
Is a Triple Top Stronger Than a Double Top?
The triple top stock pattern can be stronger than the double top stock pattern if the price action plays out correctly. This is because the triple top shows the attempts by buyers to break above the resistance level and a failure to do so.
However, there may be a higher chance that the triple top breaks to the upside than the double top, as the resistance level can get weaker every time it gets tested. This means that there may be fewer sellers left to defend the resistance level and more buyers willing to buy at higher prices. Therefore, traders should always wait for confirmation of the breakout before trading either pattern.
The Triple Top Pattern - Bottom Line
The triple top stock pattern is one of the most reliable chart patterns used in technical analysis. It indicates that the price of an asset is likely to reverse its uptrend and start a downtrend after creating three peaks near a resistance level and breaking below a support level. Traders can use this pattern to short sell an asset or go long on a breakout to the upside, depending on their market view and risk appetite.
If you want to learn more about technical analysis and becoming a profitable trader on the stock market, join the HaiKhuu Trading community today. You will get access to exclusive content, live trading sessions, morning trading reports, and more. Don’t miss this opportunity to take your trading skills to the next level!

FAQ
How reliable is a triple top pattern?
The triple top pattern is one of the most reliable chart patterns used in technical analysis. It has a high success rate of predicting a reversal in the price movement of an asset.
However, the reliability of the triple top pattern also depends on other factors, such as the duration, volatility, volume, and confirmation of the pattern. Generally, the longer and deeper the pattern, the more reliable it is. The pattern should also be accompanied by high volume on the breakout and a clear break below the support level.
What is the difference between triple top and head and shoulders?
The triple top and head and shoulders are both bearish reversal chart patterns that indicate that the price of an asset is likely to fall after creating three peaks near a resistance level and breaking below a support level. However, there are some differences between these two patterns:
In a triple top pattern, the three peaks are nearly equal in height, while in a head and shoulders pattern, the middle peak (the head) is higher than the other two peaks (the shoulders).
In a triple top pattern, the support level (the neckline) is horizontal or slightly sloped, while in a head and shoulders pattern, the neckline can be sloped up or down.
In a triple top pattern, the height of the pattern is measured from the resistance level to the support level, while in a head and shoulders pattern, the height of the pattern is measured from the head to the neckline.
What happens after triple top pattern?
After a triple top pattern is completed, the price of an asset is expected to fall further in a downtrend. The pattern gives an estimate of how far the price may fall by taking the height of the pattern (the distance between the resistance and support levels) and subtracting it from the breakout point (the lowest point of the support level). This gives a target price for traders to exit their short positions or enter their long positions.
However, not all triple top patterns result in a downtrend. Some patterns may fail to break below the support level or may break out to the upside instead. This may happen when there is a strong bullish catalyst or news that drives up demand for the asset. Therefore, traders should always wait for confirmation of the breakout before entering a trade based on this pattern.
Can a triple top be bullish?
A triple top can be bullish if it breaks out to the upside instead of the downside. This means that the buyers have overcome the sellers and pushed the price above the resistance level. This invalidates the bearish signal of the pattern and indicates a continuation of the uptrend.
What is the timeframe for the triple top pattern?
The timeframe for a triple top can vary depending on the chart that the trader is using. The pattern can occur on any timeframe, from intraday charts to weekly or monthly charts. However, the most common timeframe for trading this pattern is on the daily chart, as it provides a clear view of the price action and enough data points to confirm the validity of the pattern.