Algorithm and Portfolio Stats - 04/08/2024 - 04/12/2024
Our day trade bot is slightly negative for this week, but still positive overall. This isn’t a red flag for things at this time. We’re forecasting a Sharpe ratio in the low-mid 2’s, meaning that we don’t expect red weeks to be uncommon, but we expect red months to be relatively rare. So far, we’ve been running our new system for less than 1 month, and it’s returns are in the green - meaning that for this short sample period, it’s performing within expectations.
The system has averaged trades on 6.06 unique tickers per day, so we’re assuming equal allocations of 16.51% into all trades when we evaluate overall P&L. If you’d traded with our system, following along in this way, you’d be up 0.43%. That sounds small in terms of overall return, but keep in mind we make some pretty conservative assumptions about user allocations when estimating total profits. We assume the 16.51% equal allocation strategy because it’s the most aggressive possible strategy that guarantees never needing margin, but it also assumes that most of your capital is sitting idle through most of the day. If you’re actually following this system live, you’re almost definitely out-performing it, even if you’re taking every trade it calls out.
In terms of what’s currently in the works, we’re looking at introducing a secondary ruleset to our algorithm. The day trade is bot is currently using a strategy that’s primarily momentum-based. This means that, even though it’s successful and turning a profit, it has a weakness in that, when momentum is sideways, it tends to take on losing positions. By adding a secondary rule it can use to enter positions - one that does better in these situations - we feel we can shore this up. We’ve been backtesting a few versions of the algorithm with these new rulesets in place, and so far results are promising. Barring any particularly surprising negative findings in the next few days, we expect to move this into a live, private test later this week.
In total, we made 42 trades this week (22 long and 26 short) across 31 unique tickers. Let’s take a look at some of them.
Our strongest trade of the week was a long on RMD that we saw on Tuesday. This was one position, with no re-entries, for a return of 1.23%. Overall, this trade was a beauty. Everything we’re looking for is present here, from MACD to a lagging line safely above price action. I’m also a big fan of the exit here - we get out when MACD turns negative, and for almost the rest of the day, MACD never turns around. This is really the ideal version of what we’re looking for.
This was really a week where long position shined, as our most profitable short position only made us 0.16%. That position is above, and like our best long, it was one entry, no re-entries. Even though it didn’t return much, I do like this trade - at least on a technical level. All of the usual signs we look for are present here, and the downwards momentum is strong enough going into things that I would have taken this. I also agree with the exit point here. We can see the momentum turning around a few candles before our eventual exit, and while I would have considered getting out early around there, I absolutely understand if, seeing that live, you thought it was a fake-out and the stock would keep dropping. In that case, waiting for a strong signal to exit (like the price crossing above the Tenkan-Sen line) is the right move. Not every trade can be a winner, and not all of those that win can be big winners. But there’s nothing wrong with taking a trade that only makes a little profit.
Our worst trade of the week was a short on URI, consisting of 1 entry and 1 re-entry. We lost 0.58% here. All of our signs are there on the initial entry, but I’m not sure I would have taken it. The chart is choppy throughout late morning/early afternoon, but I’m not sure it’s severe enough that I would have refused the position entirely. What I think is more questionable here is our re-entry on the 13:30 candle. We see what looks like a definitive break below the Tenkan-Sen line, but the momentum is only strong there in the short term. With a wider lookback, we see the downward movement is much less consistent. Our MACD confirms this - it’s significantly weaker here than it was during our initial entry. This is one of those trades where the weaknesses are readily apparent, but onyl to human eyes. I think most traders would have either ignored these trades, or under-allocated them.
Now then, let’s examine our portfolio.
We finished very slightly in the green relative to SPY this week (down 1.53% versus SPY being down 1.6%). Looking at our portfolio, there’s not a lot of green, but in fairness, the market as a whole exhibited this trend. So despite big losses, we mostly matched the market’s performance this week.
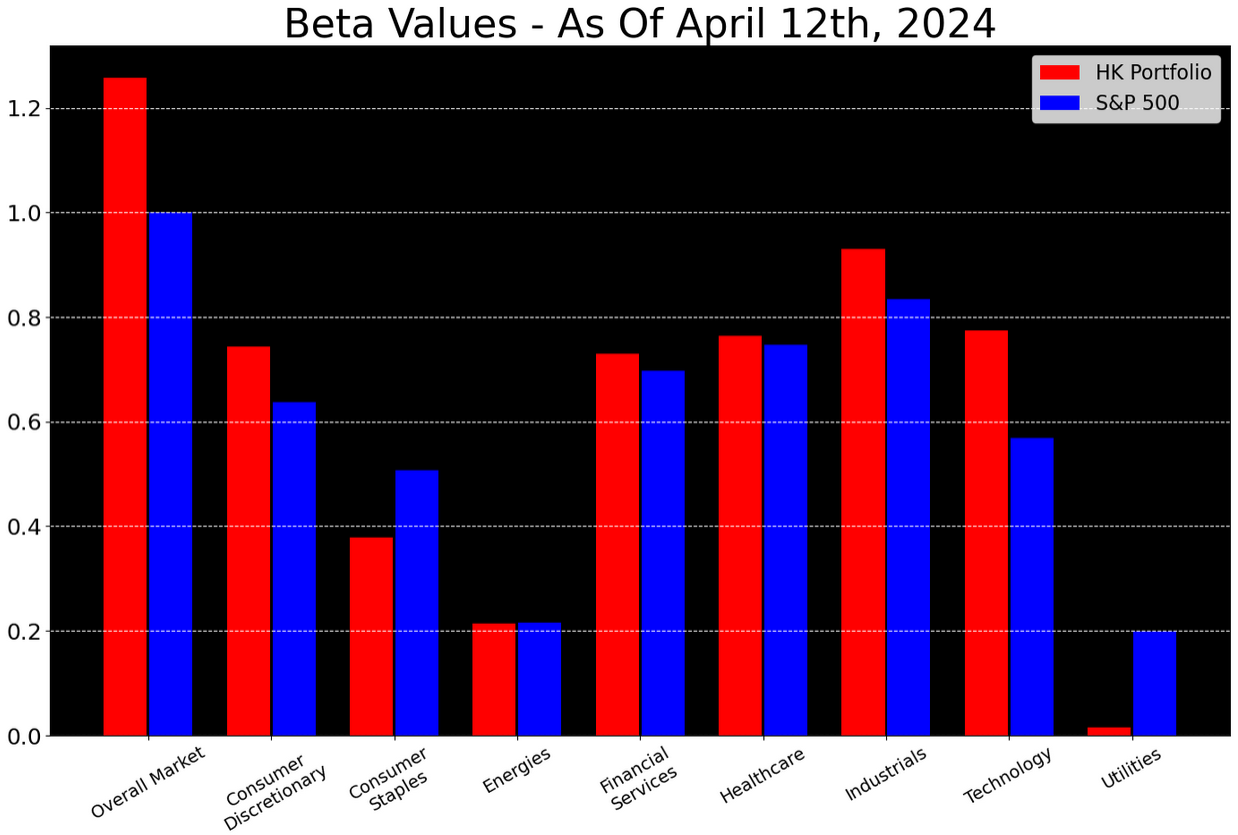
Looking forward, we’re moving closer to the S&P this week, in light of substantial macro market uncertainty. The only sectors we’re under-allocating at this time are Utilities and Consumer Staples, with tech remaining our biggest over-exposure.
I’ve included our allocations below. For brevity, all tickers with an allocation under 0.5% are excluded.
That’s all I have for you tonight - thank you for reading, and happy trading!


