Algorithm and Portfolio Stats: 04/15/2024 - 04/19/2024
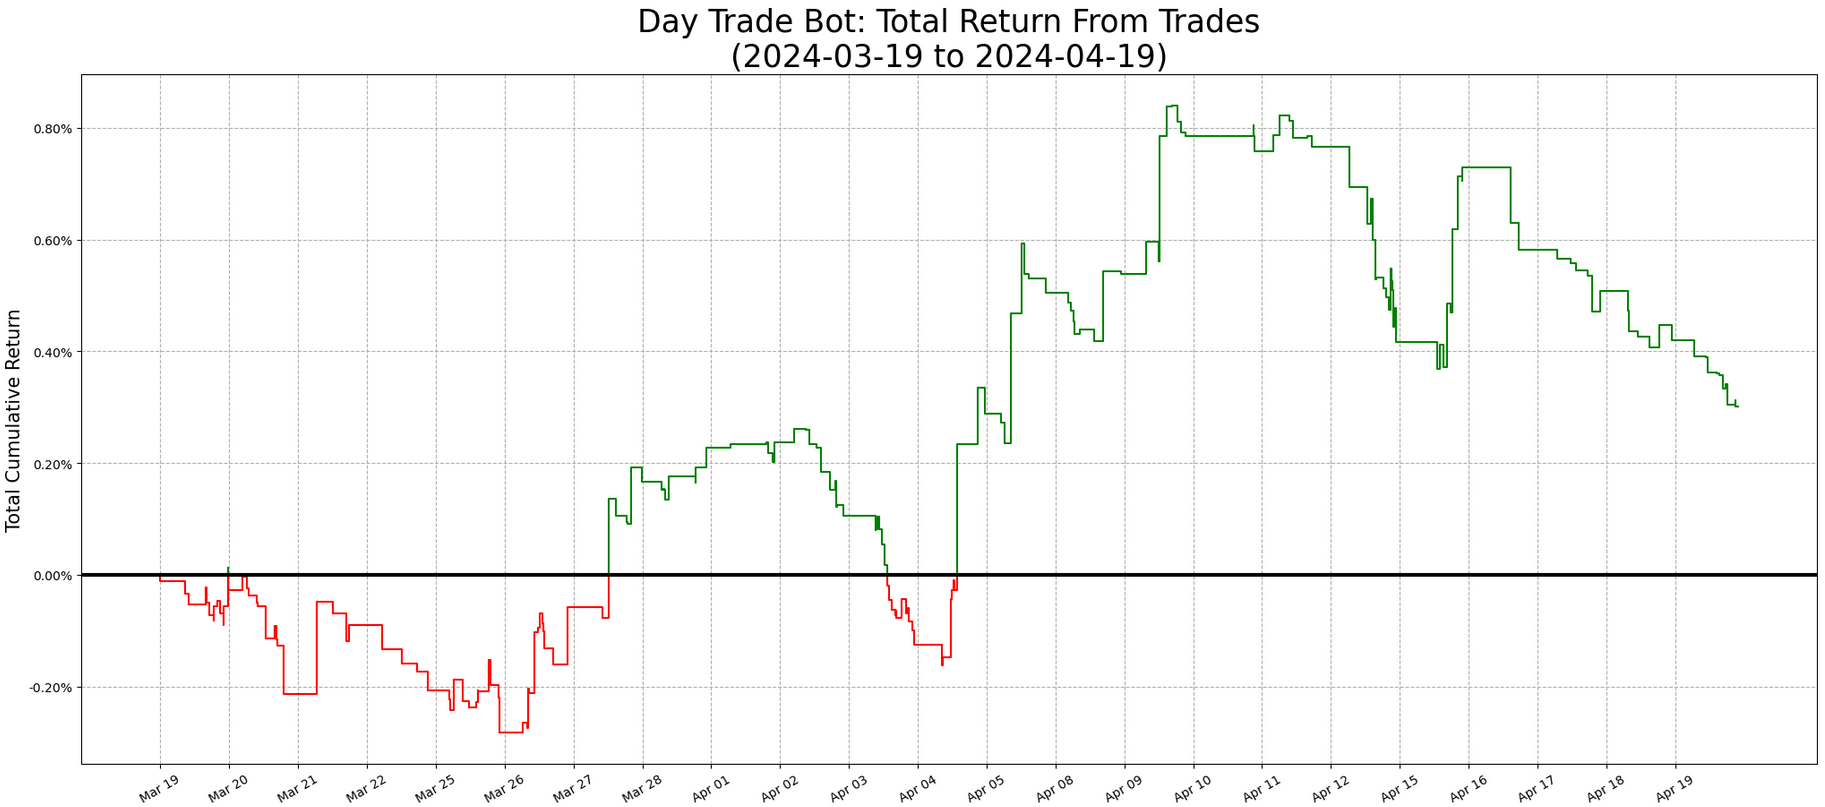
We launched this iteration of the algorithm on March 19th - meaning we officially have a full month worth of data on it. I’m happy to say that, in our first month, we’re net positive! Our system does not recommend allocations by position, so I’m going to use 2 methods to estimate your total return, had you followed the system over the last month. The first is highly inefficient, but extremely easy to do. The second takes more effort to execute, but is one we consider more realistic for an average trader.
For the first, easy strategy: we use the fact that our system can only take 1 position per ticker at a time. So we look at the average number of tickers traded per day, and assume that such a share is dedicated to each position. Under this method, we invest 18.25% of our capital into each position, and have a return of 0.30% over the last month. While this is a fairly simple method to use, we don’t consider it realistic for most of our users. Utilizing this allocation strategy requires you to leave most of your capital un-allocated for most of the time, which is something any trader will want to avoid. As such, we’re looking at the second method here for our preferred estimate.
For our second method, we look at, on average, how many positions our system is actively in at once. On average, at times our system was holding anything over the last month, it was holding 1.57 positions. So, if you want to use all of your capital, but you want to allocate more or less equally into all positions, you were able to put about 63.7% of your capital into each position, on average. Under this strategy, you would have made 1.05% this month.
There’s obviously a lot of variance to that. For example, you could have chosen to over-allocate into some positions, or under-allocate into others. You could have just not traded on a day our system made a large profit or took major losses, or had capital unavailable for new positions at the time. But overall, we’re considering that 1.05% return number a reasonable estimate here. If you made an effort to use all of your capital, and follow our system, it’s unlikely you were very far from that number.
We’ve made 217 trades (111 long and 106 short) this month, across 112 unique tickers. Let’s check out our biggest winners and losers.
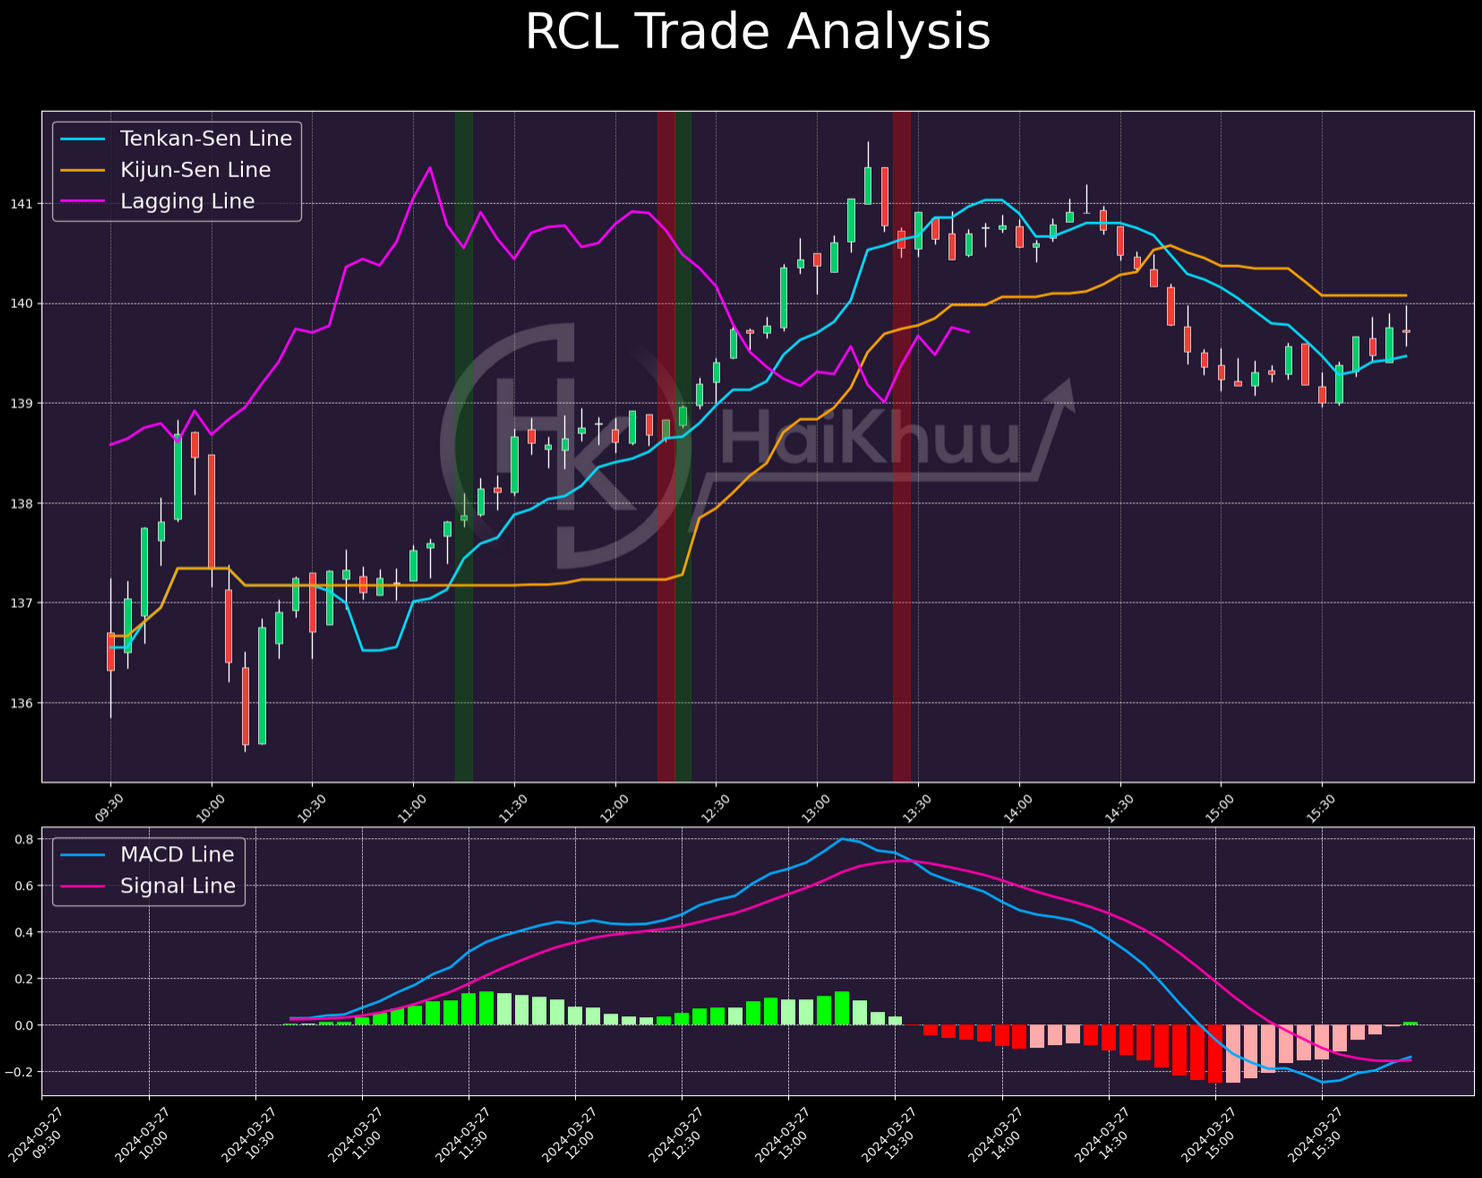
Our best trade of the last month was a long on RCL on March 27th. We had 1 entry, 1 stop-out, and 1 immediate re-entry here, for a total return of 1.72%. There’s a lot to like here. The only issue I have here is in the re-entry, since when we took it, the MACD was significantly weaker than our initial entry. That’s not a deal-breaker by itself, but definitely something to watch out for. Even if you didn’t take that re-entry, you still made a solid 0.56% here. This trade was a beauty overall - very hard to lose money on this one.
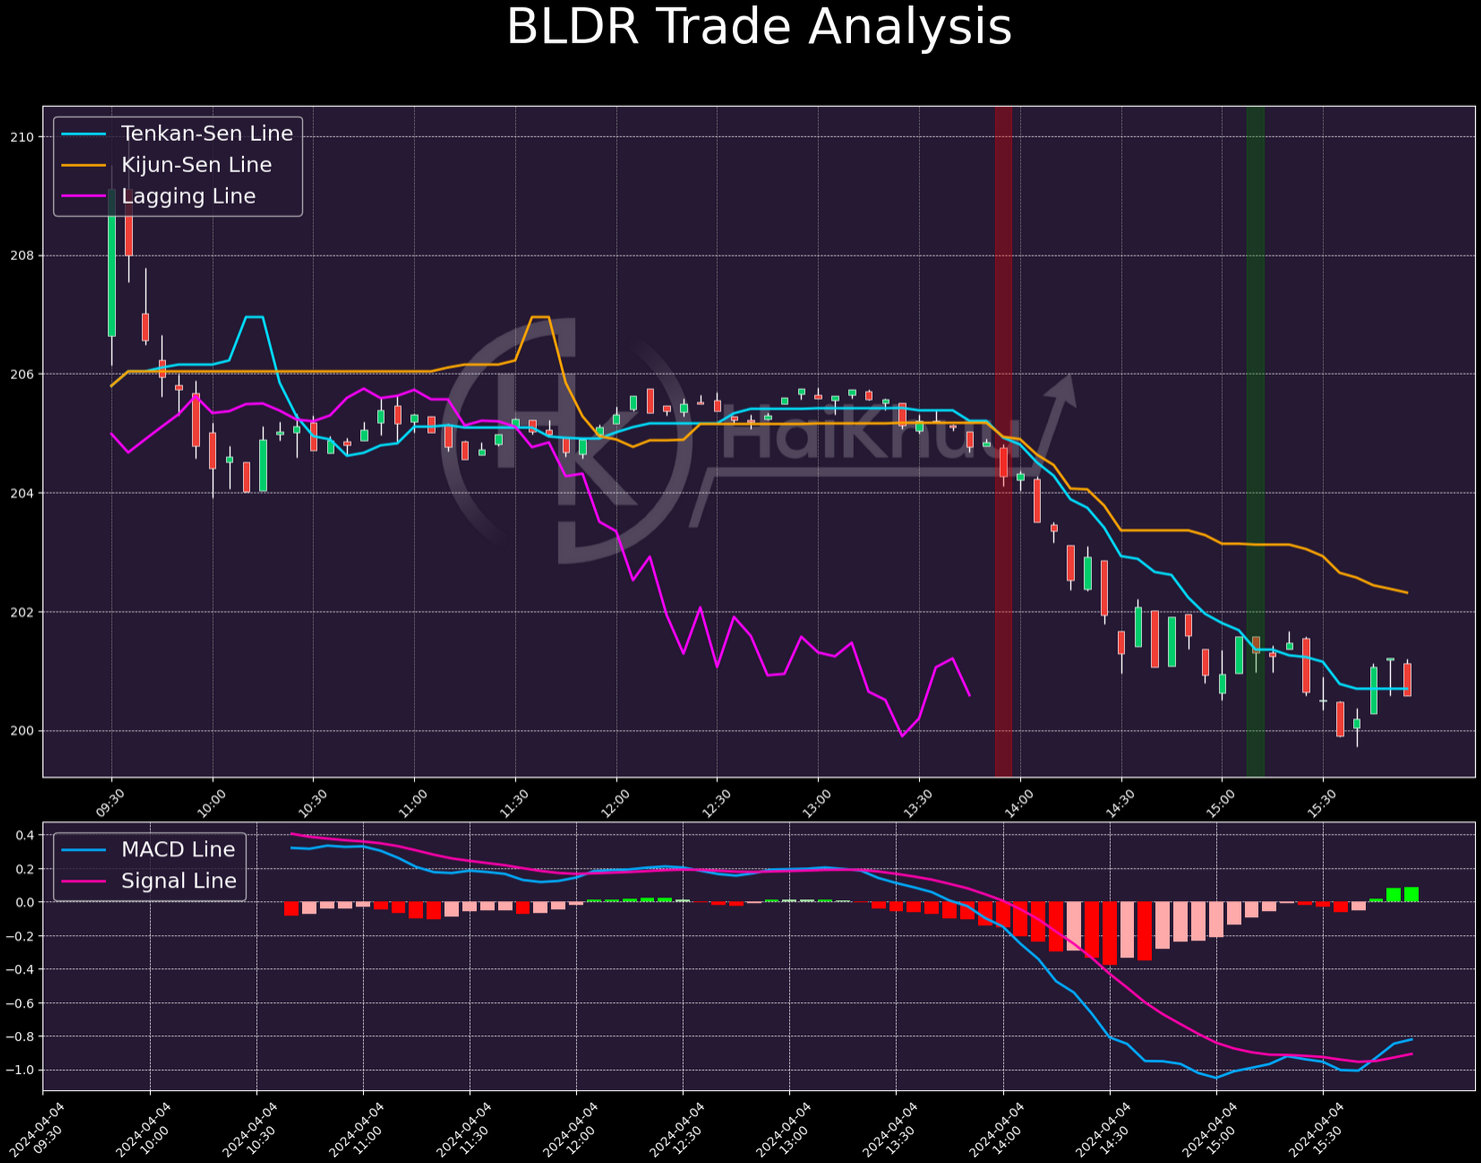
Our best short of the month was on BLDR on April 4th. No re-entries here, but we did make 1.43% on it. Again, I think there’s a lot to like here. The lagging line is where we want to see it, and both the cross and momentum are solid. The only concern I would have had here is that the Kijun-Sen line is pretty flat before our entry, but given that both TK-lines are sloping downwards when we get in, and the strong momentum, I think that red flag is pretty mitigated here. This one was a fantastic trade, with great returns.
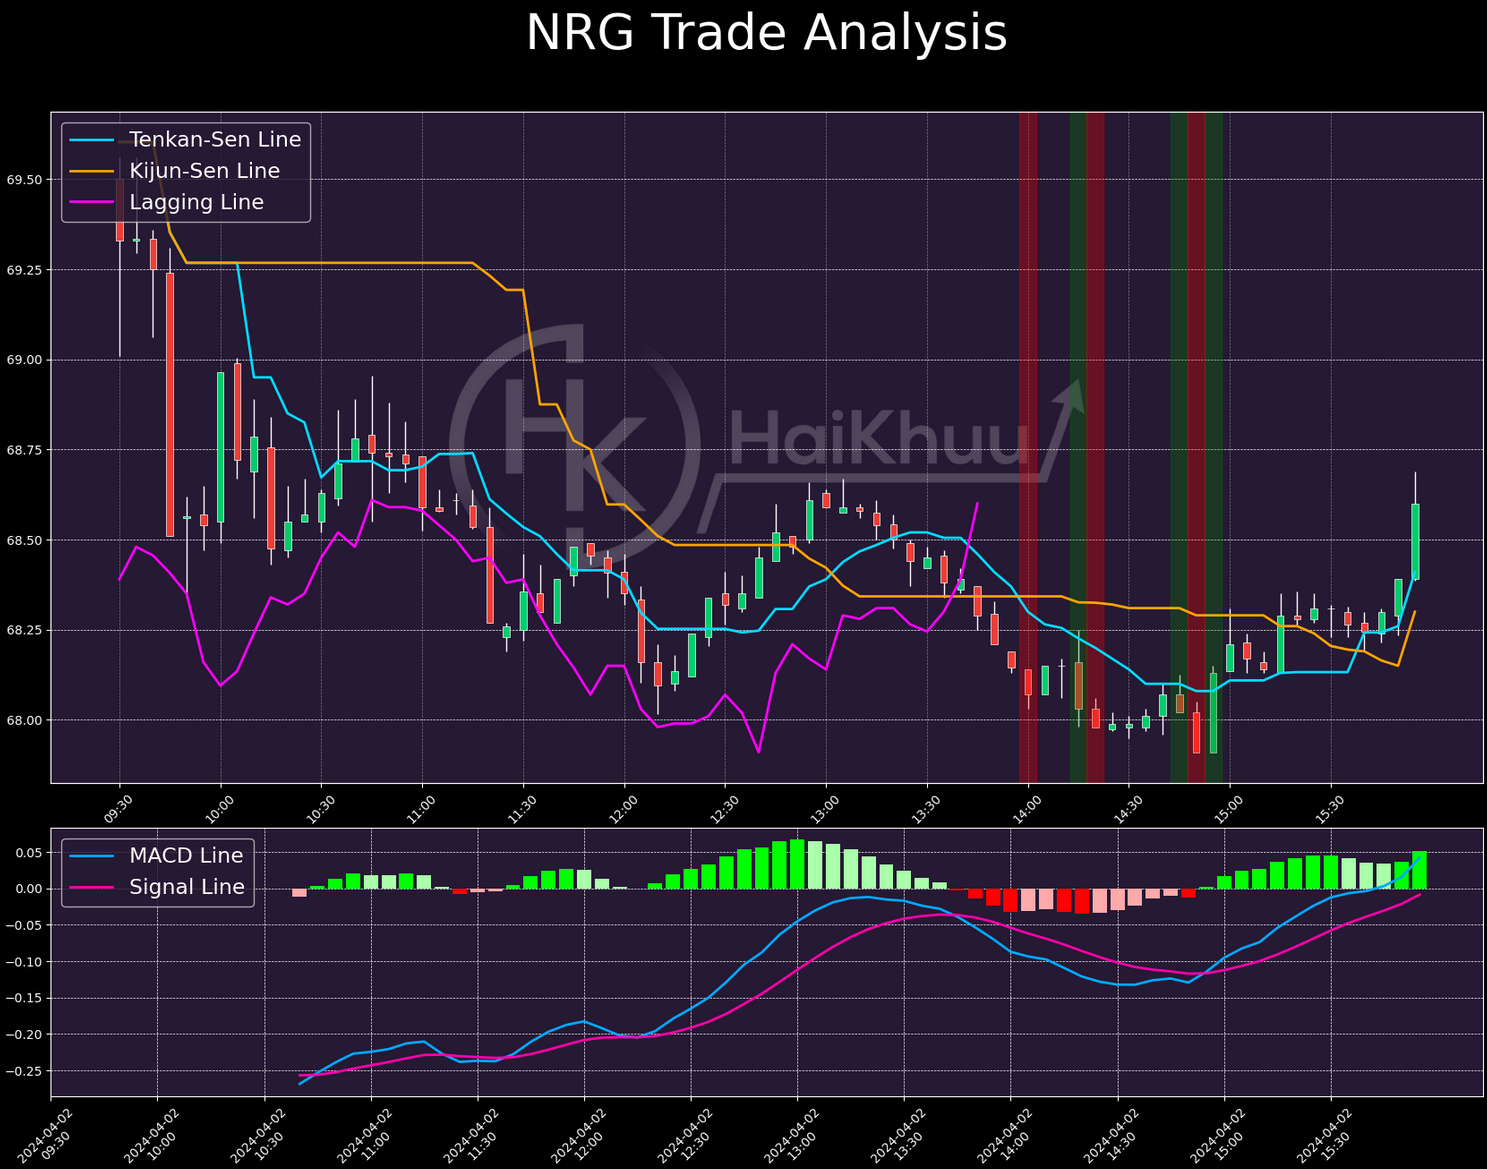
Our worst trade of the month was on NRG,where we lost 0.66% across 3 short positions. I like our initial entry, and probably would have taken it. The cross is strong, coupled with good momentum, solid enough MACD, and a cooperative lagging line. Both of our re-entries are really where we take losses. If we’d taken neither, we would have cut our losses to 0.23%. If you were following this trade, and took one or both re-entries, I think it’s relatively understandable. Both re-entries are relatively sharp downturns, following what look like fake-outs. You might have avoided these by recognizing the growing sideways momentum, but aside from that, these positions were somewhat unavoidable. Not every position is a winner, regardless of how good it looks. Some simply don’t work out for us. It’s unfortunate, but inevitable. Relative to the returns from our big winners, the loss here is fairly benign.
Now then, onto our portfolio.
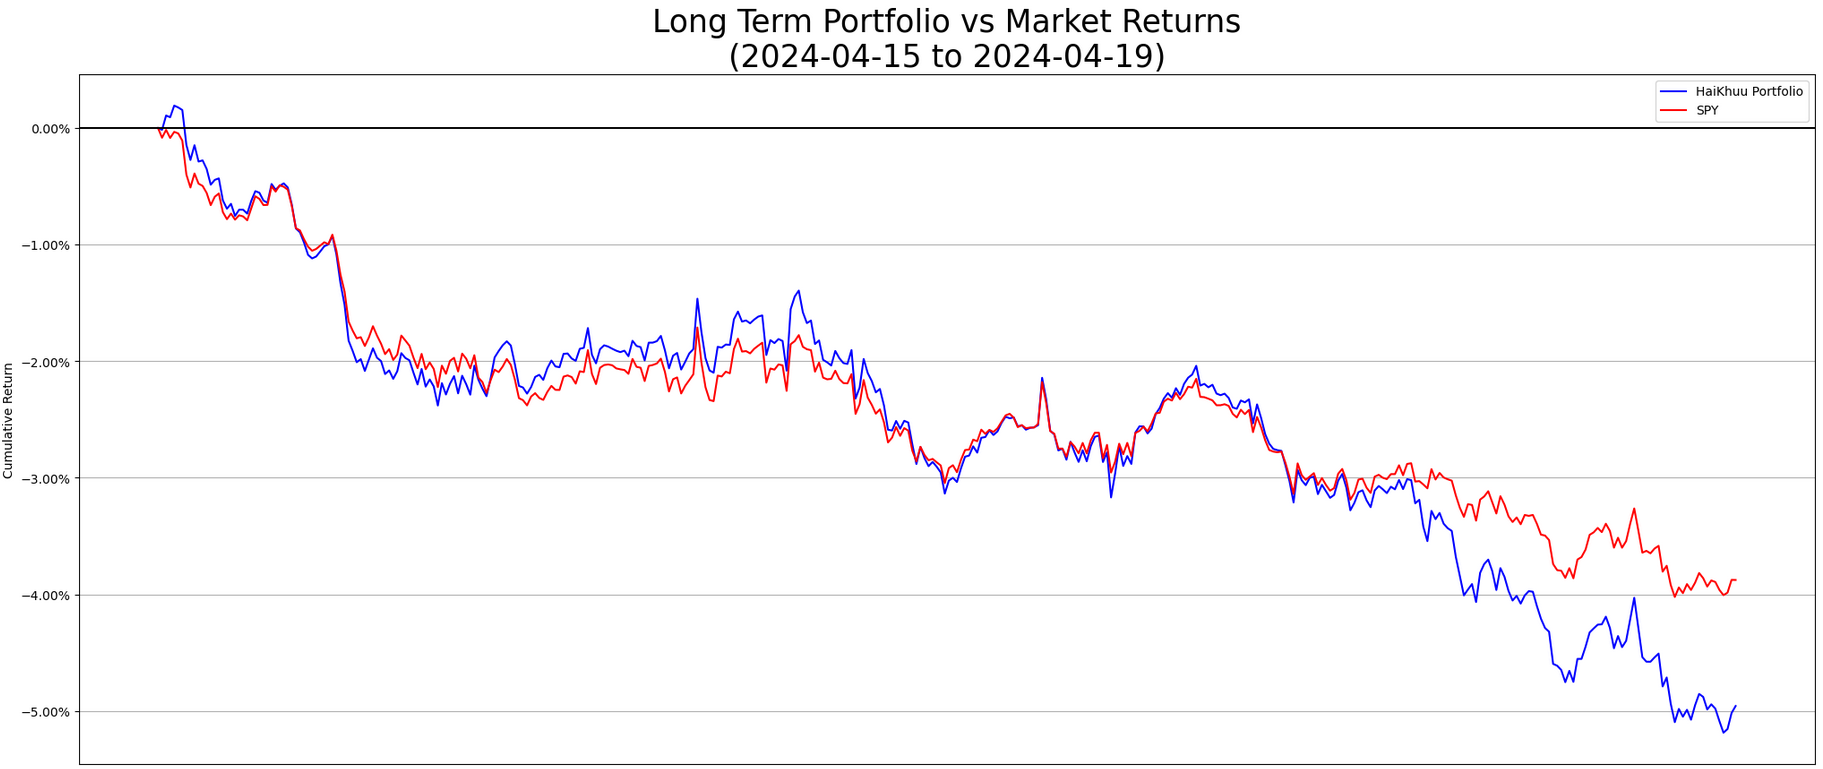
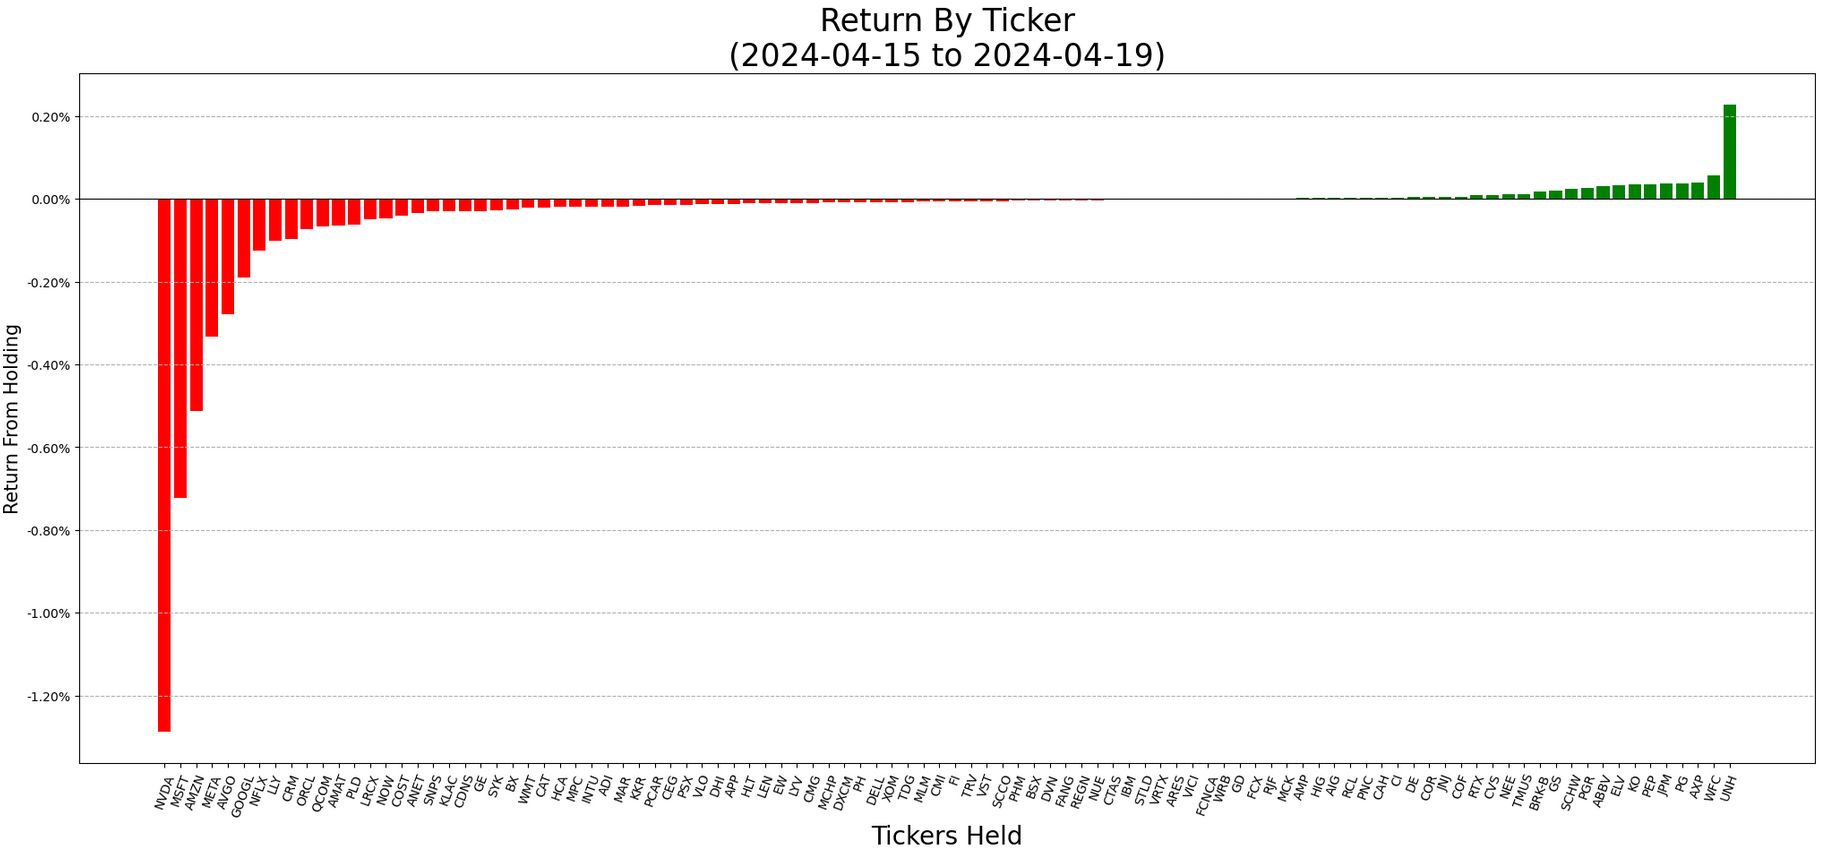
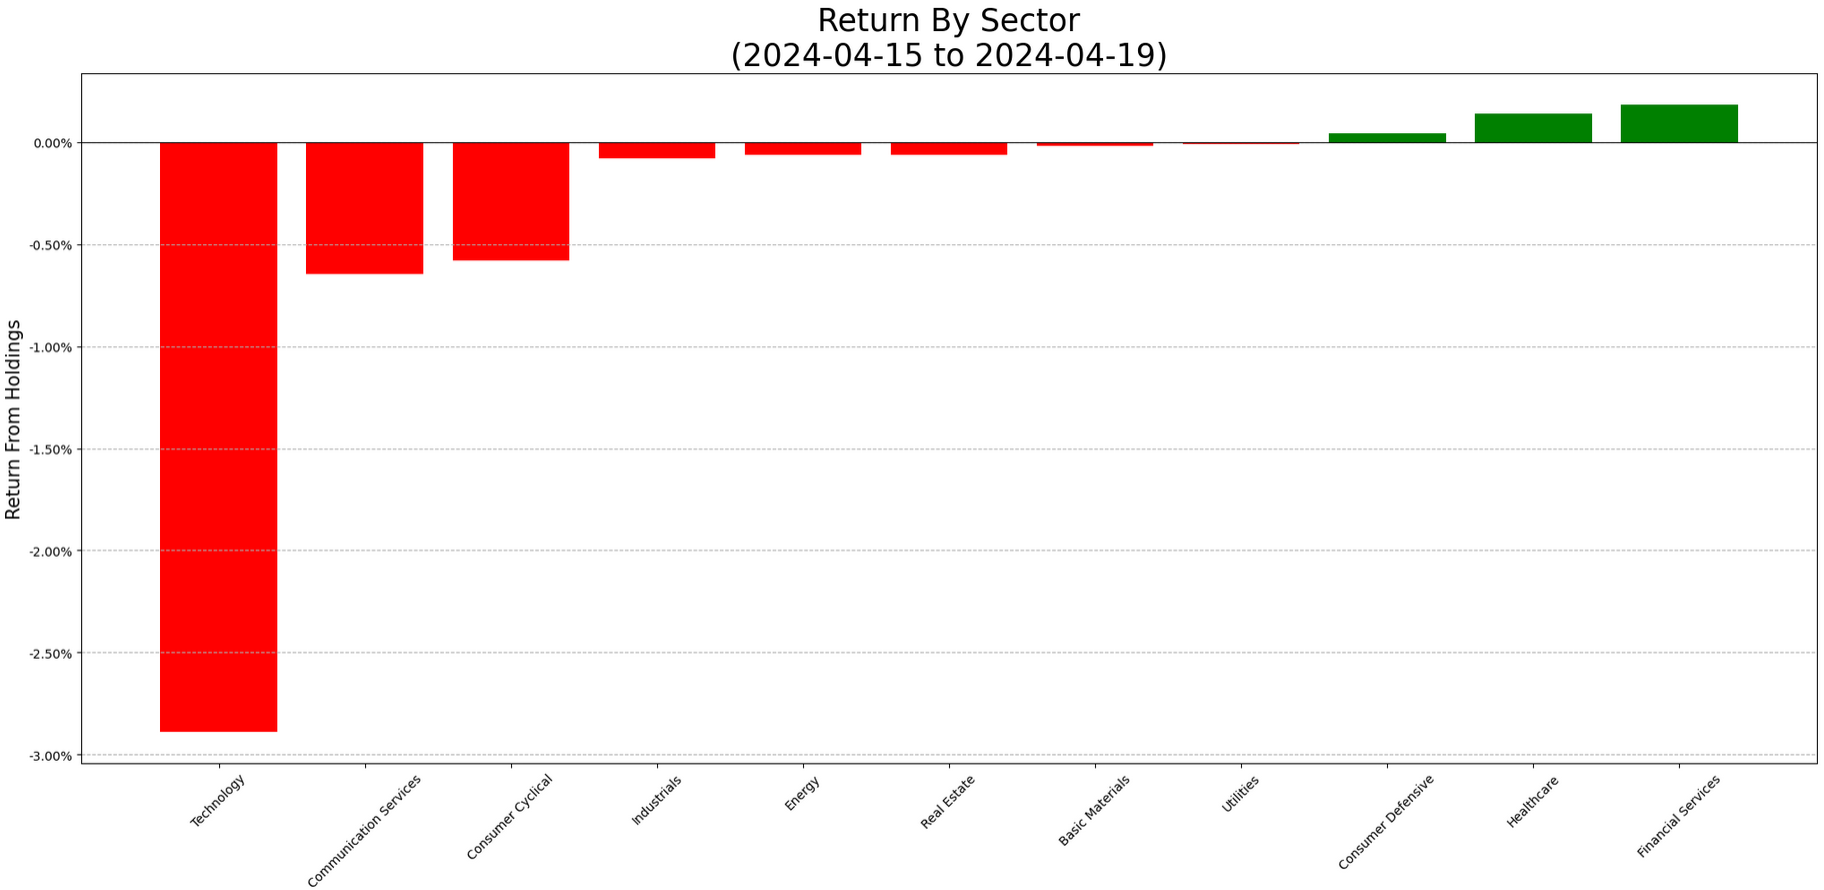
This was a bad week for our portfolio, full stop. We’re down 4.82% this week, versus SPY’s -3.88%. Tech killed us, and it killed the market as a whole. Our biggest sources of losses were our biggest allocations. NVDA was our second biggest allocation, at 9.23% of our portfolio, and was down 14.5% throughout the week. Our biggest, MSFT at more than 13%, was down 6.3%.
Our portfolio leaned speculative, and has for several weeks now. Our market beta was 1.2, with 0.2 beta over SPY in the Technology sector. If the market as a whole faced a bad week, and especially if the Technology sector under-performed, we stood to feel it more than SPY would. In short, we’ve been betting for some time on growth from Tech. This week, we bet wrong.
We’re re-adjusting our portfolio to an equal-weighting strategy this week, and taking it significantly more defensive.

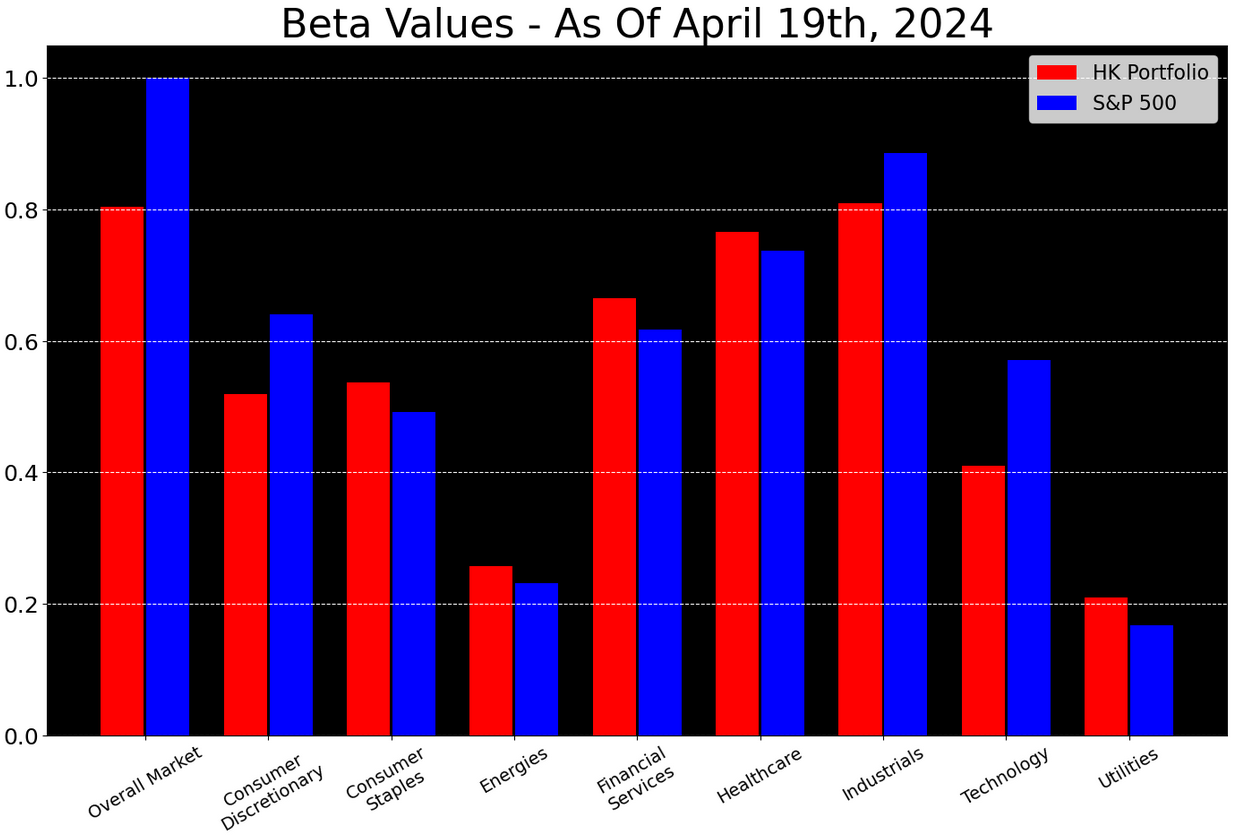
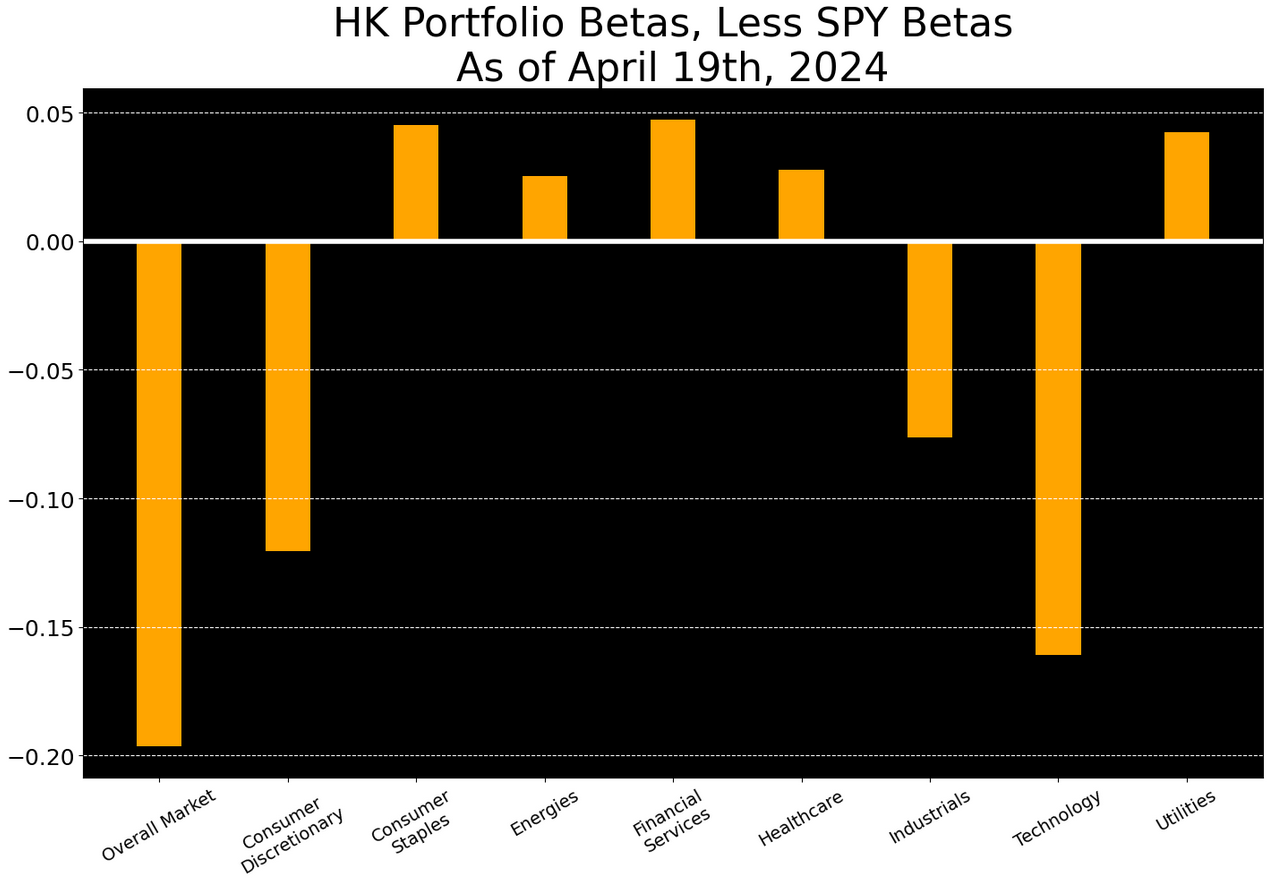
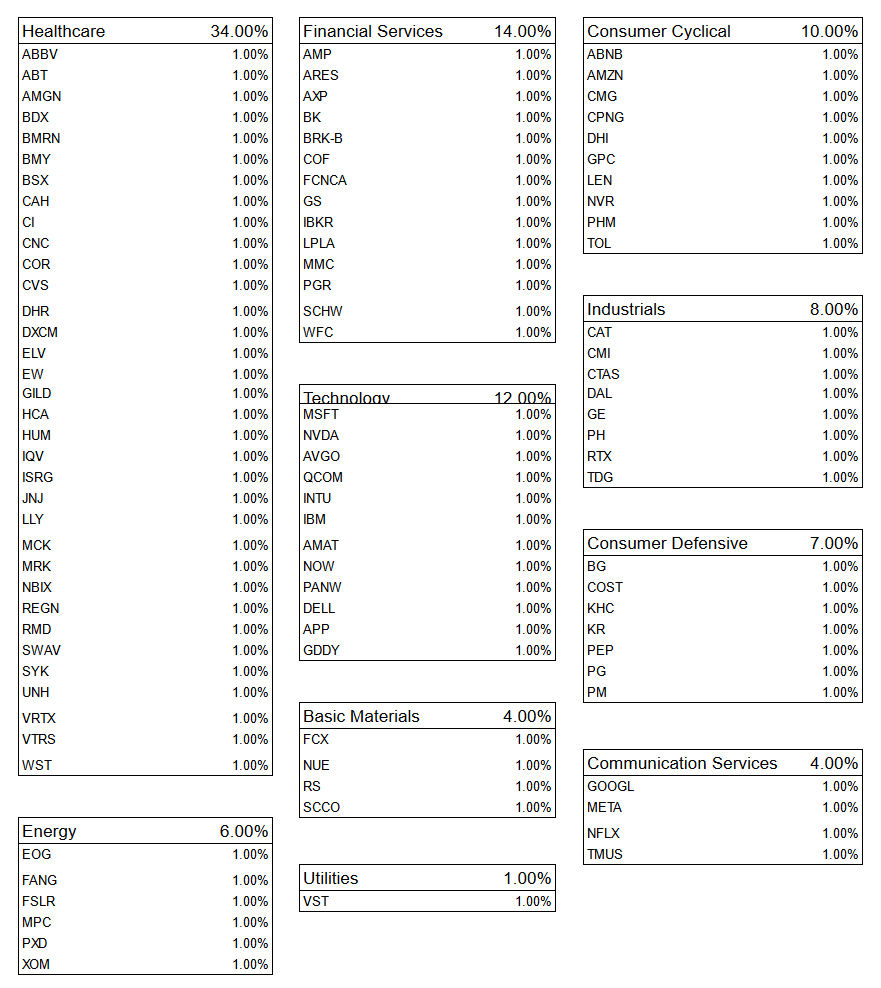
This is the most radical change we’ve made to our portfolio in a long time. For the first time this year, we have a less than 1 market beta, less technology beta than SPY, and are not allocating a plurality of our portfolio into tech.
I’ve included our new allocations below.
That’s all I have for you tonight. Thank you for reading - and happy trading!