How You Can Use the thinkorswim Volume Profile Indicator
The ThinkorSwim volume profile indicator is used to determine support and resistance levels, supply and demand zones, and to see volume by price.
Key Takeaways
Volume Profile is a charting tool used by traders to analyze the volume traded at different price levels over a given period of time.
On the Thinkorswim platform, Volume Profile can be accessed by adding the "Volume Profile" study to a chart and specifying the time period and price range for analysis.
Volume Profile can be used to identify key support and resistance levels in the market, as well as to analyze market sentiment and identify potential trading opportunities.
Traders can use the Thinkorswim Volume Profile tool to analyze the volume traded at different price levels over time, and to identify potential areas of accumulation or distribution in the market.
What is Volume Profile
The ThinkorSwim volume profile is an indicator that shows you volume by price instead of volume by time.
Volume by price is more significant because it shows which price the most people are buying and selling the stock.
Volume Profile Significant Terms
Volume Point of Control (VPOC)
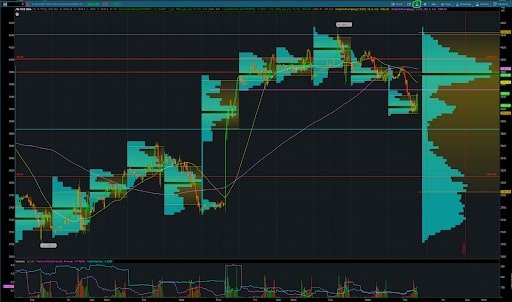
The VPOC is indicated by the green bar on the images in this article. It represents the price level with the highest volume.
High Volume Node (HVN)
The HVN is an area on the volume profile with a lot of volume and is easily spotted on chart profiles.
Low Volume Node (LVN)
Low volume nodes are areas where there is minimal volume traded. Generally, the price will move quickly through these price levels.
Value Area (VA)
The yellow range on the chart represents the value area.
Value Area High (VAH)
The value area high is the top of the value area.
Value Area Low (VAL)
The value area low is the bottom of the value area.
How to Add Volume Profile to ThinkorSwim Chart
Go to the chart tab
To add volume profile to your ThinkorSwim chart, go to the chart tab.
Click the beaker icon
Click on the beaker icon to edit your studies.
Type VolumeProfile into the search bar
Click on VolumeProfile
Next, click on volume profile, and then add selected.
Chart vs. Day Profiles
There are various settings you can use with the volume profile indicator on ThinkorSwim. The main ones are the CHART and DAY profiles.
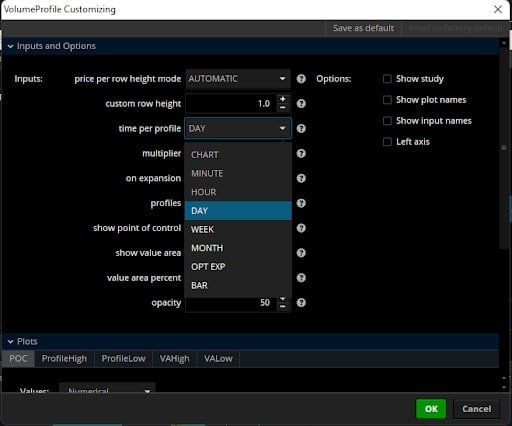
To change this setting, simply click on the gear icon next to volume profile.
Under the time per profile setting, you can change the setting to day and chart. Let’s take a look at the difference between these two.
Day Volume Profiles
In the image below, the day profiles are underlined in green. The day volume profiles track the volume by price for each day and provide a VPOC for each trading day.
It is recommended that you use the 30-minute timeframe when using the day volume profiles. Of course, you can use any timeframe you’d like, but most traders generally prefer to 30-minute timeframe or lower for this indicator.
Chart Volume Profile
The image below shows the chart volume profile. With this setting, you will see the volume profile across the entire chart’s history.
Therefore, if you have the chart set back one year, the chart volume profile will account for all the volume traded within the last year.
The chart volume profile helps check longer-term support and resistance levels rather than the levels intra-day.
Using Both Chart and Day Profiles Together
You can use both profiles together, but it is hard to see the candles on longer time frames, such as the daily chart.
Therefore, you can use this custom profile code to edit the indicator's code to only show the day profiles on timeframes shorter than the daily.
How to Read the Volume Profile
Reading the ThinkorSwim volume profile takes time and experience, but it provides many contexts that can help you determine support and resistance levels.
The price of a stock tends to gravitate towards areas of value, which are found by searching for HVNs.
Additionally, LVNs are a sign that if the stock breaks into them, it will move quickly to the next HVN.
Identifying Supply and Demand Zones
The volume profile is excellent for determining supply and demand zones. Since we know which price levels have the most volume, we can assume that this is where most traders' cost basis is.
However, we do not know whether there are more people short or long at that price level.
Supply Zones
When the price is below an HVN, the HVN is a supply zone. We determine this because the shorts are winning when the stock is trading below the HVN. Therefore, when the price returns to the HVN, both longs and shorts will return at their cost basis/breakeven price.
The image above shows an excellent example of a VPOC/HVN acting as a breakeven supply level. Since we know most people’s cost basis is at that level, and the price is trading below it, the shorts are currently winning.
We also know that prices will naturally gravitate towards areas of high volume. So when the price is below the HVN, the shorts may start covering their positions with buy orders and taking profit, driving the price back up to the supply price level.
Demand Zones
You can identify a demand zone when the price of a stock is trading above a VPOC or HVN. The image below shows an example of a demand zone.
Since the stock price is above the HVN, we know that the longs at that price level are winning. Therefore, they may start selling their positions and taking profit, driving the price back down to the high-value areas.
ThinkorSwim Volume Profile Trading Strategies
You can use many strategies with the volume profile, but let’s take a look at two of the best ones.
Fading Extreme Levels
The day volume profiles are easily compared to a standard deviation bell curve. The volume point of control is right in the middle, and the extreme levels are at the ends of the bell curve.
The stock price will generally revert to VPOC, so traders can short at the top of the extreme level and play it back to the VPOC.
Additionally, you can buy at the low end of the extreme level and sell the stock at the VPOC.
Of course, nothing is guaranteed in the stock market, and you must set stop losses to limit the loss potential.
Playing Continuations to the Extremes
Another strategy is to buy when the price picks a direction away from the VPOC.
For example, if the stock is consolidating at the VPOC, then breaks above it, you can buy it and sell at the higher end of the bell curve.
Other ThinkorSwim Indicators
The volume profile is one of the many indicators available on ThinkorSwim. Other popular indicators include the Ichimoku clouds, VWAP, RSI, and anchored VWAP.
If you want hands-on help learning about technical analysis, the HaiKhuu Trading Discord Community is the best resource available. The community and its professional traders will provide all the help you need to become a successful trader on the stock market.
FAQ
What is thinkorswim Volume Profile?
thinkorswim Volume Profile is a trading tool available on the thinkorswim platform, offered by TD Ameritrade. It represents trading activity over a specified time period at different price levels, providing insights into the volume distribution and the dominant price values in terms of volume.
How do I add a volume profile to TOS?
To add Volume Profile to your chart on thinkorswim, go to Studies -> Type volumeprofile -> Click volumeprofile -> Click add selected.
Does TD Ameritrade have volume profile?
Yes, TD Ameritrade offers Volume Profile as one of its default charts on the thinkorswim platform.
Can I customize thinkorswim Volume Profile?
Yes, thinkorswim Volume Profile can be customized to suit your trading preferences. You can adjust the aggregation period, which determines the time frame over which the volume data is calculated. Additionally, you can customize the appearance of the Volume Profile histogram, including color settings and transparency, to enhance its visibility on your charts.
What information does thinkorswim Volume Profile provide?
thinkorswim Volume Profile provides a visual representation of trading volume at different price levels. It displays a histogram that shows the volume distribution, allowing traders to identify areas of high and low volume concentration. It also helps to identify the point of control, which is the price level with the highest volume, and the value area, which is the shaded area around it that covers one standard deviation of the volume.
How can I use thinkorswim Volume Profile for trading?
thinkorswim Volume Profile can be used to determine support and resistance levels, supply and demand zones, and to see volume by price. In conjunction with other indicators such as price movement, trend lines, and other technical indicators, the Volume Profile provides the trader with a complete picture of the trading environment. Some traders use the point of control and the value area as potential entry and exit points, while others use them as areas to place stop-loss orders or take-profit orders. The volume profile can also help to identify market sentiment and trend direction by showing whether the volume is increasing or decreasing at certain price levels.
How to Learn More About the Stock Market
If you want to learn more about the stock market, joining a community of like-minded individuals is a great way to accelerate your learning curve.
Benefits of Joining a Trading Community
Converse with thousands of other experienced traders
When you join a community, you can talk with other traders with unique viewpoints on the stock market.
Learn new strategies
There are a million ways to trade on the stock market, and you will surely learn new strategies when you talk with other traders.
Stay up to date on the latest stock market news
Additionally, trading communities will keep you updated on the latest economic news. You can also ask questions if you don’t understand some of the complex financial terms.
The HaiKhuu Trading Community
The HaiKhuu Trading community is one of the largest stock trading communities online, with over a quarter million members within its communities.
The community includes beginner and professional traders who can assist with your day-to-day trading activities.


