TTM Squeeze Thinkorswim: The TTM Squeeze Indicator
Trading in the stock market can be exhilarating, especially when you can identify the perfect moment to enter a trade right before a stock makes a massive move. While some may attribute this to luck, successful traders know that using the right technical analysis tools can make all the difference.
One such tool is the TTM Squeeze indicator, available on the Thinkorswim trading platform. In this article, we'll explore the TTM Squeeze indicator, its key features, and how you can use it to enhance your trading strategy.
Understanding the Concept of a Squeeze
A "squeeze" in trading refers to a specific market condition that precedes a substantial price movement. There are two primary types of squeezes:
Short Squeeze: Occurs when a stock experiences a sudden upward price movement due to short sellers covering their positions. This can happen when positive news or rumors drive the price higher, forcing short sellers to exit and adding to the buying pressure.
Price Consolidation Squeeze: Happens when a stock is in a period of consolidation, building up energy before making its next big move. During this phase, the stock price may move sideways, indicating that a breakout is imminent.
What is the TTM Squeeze Indicator?
The TTM Squeeze indicator is a popular tool developed by John Carter to help traders identify potential squeezes in the market. It uses a combination of Bollinger Bands and Keltner Channels to measure market volatility and detect periods of consolidation.
What Does TTM Squeeze Mean?
"TTM" stands for "Trade The Markets," representing the company founded by John Carter. The TTM Squeeze indicator is designed to highlight moments when the Bollinger Bands contract and move within the Keltner Channels, indicating a "squeeze" in progress. When the bands expand and move outside the Keltner Channels, the squeeze is released, signaling a potentially significant price movement.
Is TTM Squeeze a Good Indicator?
The TTM Squeeze is considered a powerful and versatile indicator for several reasons:
It helps traders identify periods of low volatility that often precede strong breakouts.
It provides visual signals for both consolidation (squeeze) and potential breakouts (release).
It works well in various timeframes and can be used for different trading styles, including swing and day trading.
What Indicator to Use with TTM Squeeze?
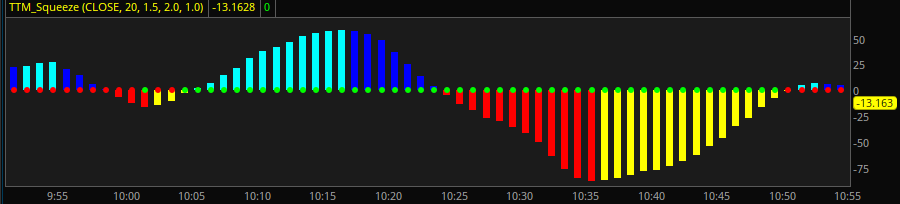
The TTM Squeeze indicator is often used in conjunction with a Momentum Oscillator histogram. This histogram provides valuable insights into the direction of the momentum:
Positive histogram values suggest bullish momentum and a potential upward price movement.
Negative histogram values suggest bearish momentum and a potential downward price movement.
By combining the TTM Squeeze indicator with the Momentum Oscillator, traders can obtain clearer buy and sell signals based on both price volatility and momentum.
Understanding TTM Squeeze Pro and Its Colors
For traders looking for an enhanced version of the TTM Squeeze indicator, the TTM Squeeze Pro offers additional features. The TTM Squeeze Pro uses color coding to provide more detailed information about the market's current state:
Red: Indicates a squeeze is in progress (consolidation phase).
Green: Indicates the squeeze has been released (potential breakout).
Yellow: Represents a transition phase between red and green.
The color-coded dots on the TTM Squeeze Pro help traders easily visualize market conditions and make informed decisions.
What is the Best Timeframe for TTM Squeeze?
The TTM Squeeze indicator is versatile and can be used effectively in multiple timeframes. The best timeframe to use depends on your trading style:
Day Traders: Shorter timeframes, such as the 5-minute, 15-minute, and 1-hour charts, can provide more frequent trading opportunities for day traders.
Swing Traders: Intermediate timeframes such as the 1-hour, 4-hour, and daily charts may be more suitable for swing traders looking to capture larger price movements over several days.
Long-Term Investors: Weekly and monthly charts can offer valuable insights into long-term trends for investors with a longer investment horizon.
Ultimately, the choice of timeframe should align with your trading goals and risk tolerance.
Adding the TTM Squeeze Indicator to Thinkorswim Charts
Adding the TTM Squeeze indicator to your charts on the Thinkorswim platform is a straightforward process:
Open the Thinkorswim platform and navigate to the chart of the stock or asset you want to analyze.
Click on the "Studies" button at the top of the chart window.
Select "Add Study," then "All Studies."
Scroll down to find "TTM Squeeze" and click on it to add the indicator to your chart.
You can customize the settings of the TTM Squeeze indicator, such as the length of the Bollinger Bands and Keltner Channels, based on your preferences.
Tips for Successful Trading with the TTM Squeeze Indicator
Combine the TTM Squeeze indicator with other technical analysis tools such as moving averages, support and resistance levels, and chart patterns for a more comprehensive analysis.
Practice proper risk management, including setting stop-loss orders and position sizing, to protect your capital.
Avoid relying solely on the TTM Squeeze indicator for trading decisions. Consider using it as a confirmation tool along with other technical and fundamental factors.

TTM Squeeze Indicator | Bottom Line
The TTM Squeeze indicator is a valuable tool for traders looking to identify potential explosive moves in the market. By understanding the concept of a squeeze, interpreting the signals of the TTM Squeeze indicator, and using it in conjunction with other technical analysis tools, you can enhance your trading strategy and seize lucrative opportunities on the Thinkorswim platform.