How to Use the Bookmap on thinkorswim
If you are a trader who wants to gain an edge in the market, you need to have a clear understanding of the order flow. Order flow is the movement of buy and sell orders in the market, which reflects the supply and demand dynamics and the intentions of market participants. By analyzing the order flow, you can identify trading opportunities, anticipate price movements, and execute your trades with confidence.
But how can you access and analyze the order flow data? This is where Bookmap Thinkorswim comes in. thinkorswim Bookmap is a combination of two powerful tools that can help you visualize and analyze the order flow in real time.
In this article, we will explain what Bookmap and Thinkorswim are, how they can be used together, and what are the main features and benefits of the Bookmap on Thinkorswim.

Bookmap on thinkorswim
What is Bookmap?
Bookmap is a software that visualizes real-time market data and provides analytical tools for order flow analysis. Bookmap can be used with various brokers and data providers, including thinkorswim.
Bookmap displays the order flow data in a heatmap-style chart, which shows the pending orders at different price levels and how they change over time.
Some of the key components of Bookmap are:
Heatmap: A color-coded display of pending orders at different price levels. The heatmap shows the liquidity and order book dynamics in the market. The colors on the heatmap correspond to the color-gradient scheme selected on the toolbar. The colors on the right side of the color gradient have the highest liquidity. By default, this color is a vibrant red.
Volume dots: A representation of traded volume per time at a specific price. The color of each dot represents whether its a buy or sell order: red is for selling, and green is for buying. You can customize the location and size of the dots in settings.
Volume bars: A representation of total traded volume over a specified period of time. You can customize the volume bars in settings as well.
Indicators: A set of analytical tools that provide additional information about the order flow and market conditions. Some of the indicators available on Bookmap are Cumulative Volume Delta (CVD), Large Lot Tracker, Order Book Imbalance, VWAP, etc.
How to Use Bookmap with thinkorswim?
Bookmap is integrated with thinkorswim and can be accessed from the platform. To use Bookmap with thinkorswim, you need to have a TD Ameritrade account and subscribe to Bookmap through thinkorswim. You can also use Bookmap directly from its website, but you will need to subscribe separately and use a different data provider.
There are some limitations and differences when using Bookmap through thinkorswim compared to using it directly from its website. For example:
You won’t be able to use add-ons from the marketplace (e.g., the MBO Bundle – Stops and Icebergs Tracker & Liquidity Tracker Pro)
You won’t be able to use the Replay mode
You won’t be able to use Bookmap to trade or use any other Global+ advanced feature (right now only the Global Package is provided)
You won’t be able to use the latest Bookmap versions
You will use Dxfeed data for both stocks and futures
To get started with Bookmap on thinkorswim, follow these steps:
Contact TOS support to enable Bookmap for you.
Once Bookmap is enabled, go to the Charts tab on thinkorswim and click on the Bookmap button on the top left corner.
You will see a Bookmap window with a heatmap-style chart of the selected symbol. You can customize the display parameters and the visibility of the components using the toolbar or the right-click menu.

How Much Does Bookmap on thinkorswim Cost?
There is a free thinkorswim Bookmap you can use on three different tickers, including MSFT, AAPL, and mini ES futures. To use it on all tickers, you must subscribe.
The pricing options for using Bookmap with thinkorswim are as follows:
You can subscribe to Bookmap directly through thinkorswim for $39.99 per month. This will give you access to Bookmap and the data as part of TOS.
You can subscribe to Bookmap directly from its website for $16 to $99 per month, depending on the plan. This will give you access to Bookmap and its advanced features, but you will need to use a different data provider.

Bookmap thinkorswim Cost
How to Interpret the Heatmap on Bookmap?
The heatmap is one of the most important components of Bookmap, as it shows the pending orders at different price levels and how they change over time.
The colors on the heatmap correspond to the color-gradient scheme selected on the toolbar. Colors on the right side indicate price levels with the highest liquidity, and the left side indicates prices with the least liquidity. The higher the liquidity, the more orders are waiting to be executed at that price level.

Right-Side Colors = More Liquidity
By analyzing the heatmap, you can identify support and resistance levels, order book imbalances, and trading opportunities in the market. For example:
Support and resistance levels are price levels where there is a high concentration of liquidity, which acts as a barrier to price movements. The heatmap shows these levels as vibrant colors, indicating strong supply or demand zones.
Order book imbalances are situations where there is a significant difference between the liquidity on one side of the market versus the other side. The heatmap shows these imbalances as contrasting colors, indicating potential pressure or attraction zones for price movements.
Trading opportunities are situations where there is a change in liquidity that signals a shift in market sentiment or direction. The heatmap shows these changes as color transitions, indicating possible entry or exit points for trades.
How to Interpret the Volume Dots on Bookmap?
The volume dots are another important component of Bookmap, as they show the traded volume per time at a specific price.
The color of each dot represents whether it's a buy or sell order: red is for selling, and green is for buying. You can customize the location and size of the dots in settings.
What are the Additional Features of Bookmap thinkorswim?
Besides the heatmap and volume dots, Bookmap thinkorswim also offers some additional features and indicators that can provide additional information about the order flow and market conditions. You can view and edit these features using the studies configuration button. Some of these features and indicators are:
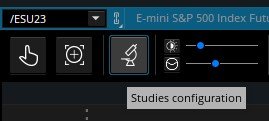
Studies Configuration Button
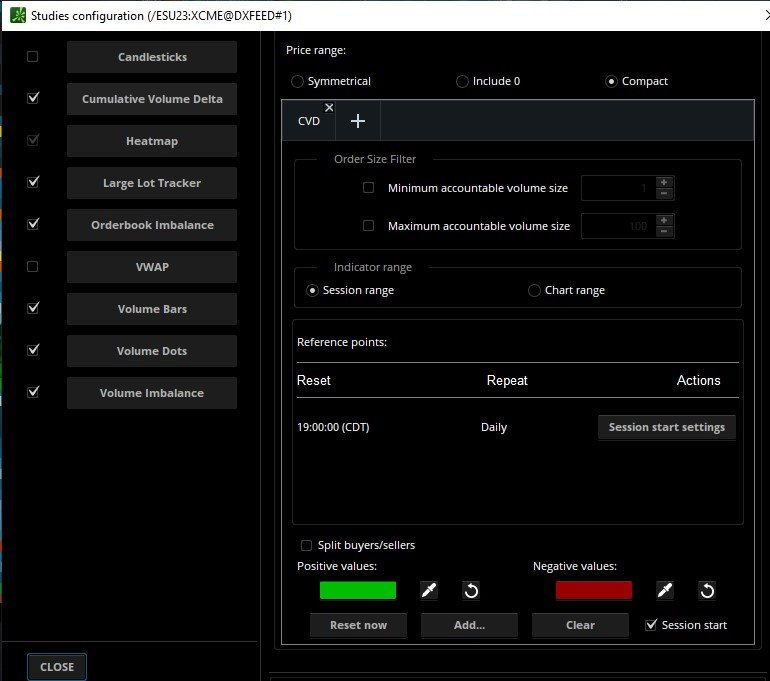
The Window After Clicking Studies Configuration
Candlesticks

You can show candlesticks on Bookmap chart by clicking on the Candlesticks button on the toolbar or by right-clicking on the chart and going to Configure visible components > Candlesticks.
Cumulative Volume Delta

CVD is at the Bottom of the Chart
Cumulative Volume Delta (CVD) is an indicator that shows the cumulative volume changes based on the volume traded by buy vs sell aggressors. It is displayed on the indicator and widget pane on the right side of Bookmap chart.
You can add CVD to your Bookmap chart by clicking on the Add Indicator button on the toolbar or by right-clicking on the chart and going to Add Indicator > Cumulative Volume Delta.
CVD can help you measure the strength of buyers and sellers in the market and identify potential shifts in market sentiment or direction.
Large Lot Tracker
Large Lot Tracker is a feature that shows an estimate of the biggest single order waiting to be filled at any price level if that order exceeds a certain limit. It is shown by a vertical white line on the order bars on the COB column.
You can enable Large Lot Tracker on your Bookmap chart by clicking on the Large Lot Tracker button on the toolbar or by right-clicking on the chart and going to Configure visible components > Large Lot Tracker.
Large Lot Tracker can help you identify the presence of a dominant market participant(s) at a certain price level and anticipate their impact on price movements.
Order Book Imbalance

Order Book Imbalance is an indicator that shows the ratio between the average bid vs ask order book size. It is displayed as a horizontal bar at the top right of the chart with a color-gradient scheme that ranges from red to green.
You can add Order Book Imbalance to your Bookmap chart by clicking on the Add Indicator button on the toolbar or by right-clicking on the chart and going to Add Indicator > Order Book Imbalance.
Order Book Imbalance can help you detect areas of high or low liquidity in the market and potential pressure or attraction zones for price movements.
VWAP
VWAP stands for Volume-Weighted Average Price. VWAP is displayed as a horizontal line across the Bookmap chart with a color-gradient scheme that ranges from blue to yellow.
You can add VWAP to your Bookmap chart by clicking on the Add Indicator button on the toolbar or by right-clicking on the chart and going to Add Indicator > VWAP.
VWAP can help you determine the fair value of a security and identify areas of support and resistance in the market.
Volume Bars
Volume Bars are displayed as vertical bars below the heatmap with a color-gradient scheme that ranges from red to green.
You can add Volume Bars to your Bookmap chart by clicking on the Volume Bars button on the toolbar or by right-clicking on the chart and going to Configure visible components > Volume Bars.
Volume Bars can help you analyze the distribution of volume across different price levels and identify areas of high or low trading activity in the market.
Bookmap thinkorswim | Bottom Line
The Bookmap on thinkorswim is a powerful tool for order flow analysis and trading. It allows you to visualize and analyze real-time market data using heatmap, volume dots, volume bars, and indicators. It also allows you to execute your trades from your TD Ameritrade account using the thinkorswim platform. Another great order flow indicator is the volume profile.
By using Bookmap with thinkorswim, you can access higher time-frame charts, analyze the order flow, and trade from one place. You can also customize your display parameters and visibility of components according to your preferences and trading style.
If you want to learn more about trading on the stock market using various indicators and strategies, we invite you to join the HaiKhuu Trading community. You will get access to educational resources, live trading sessions, expert guidance, and a supportive network of traders. Join us today and take your trading to the next level!

FAQ
Is Bookmap available on thinkorswim?
Yes, Bookmap is available on thinkorswim as an integrated feature. You can access Bookmap from the Charts tab on thinkorswim and use it with your TD Ameritrade account. You need to contact TOS support to enable Bookmap for you.
Is Bookmap worth it for trading?
Bookmap is worth it for trading if you want to visualize and analyze the order flow in real time. Bookmap can help you identify support and resistance levels, order book imbalances, trading opportunities, trends, reversals, breakouts, and trading signals in the market.
Can I use Bookmap on mobile?
No, Bookmap is not available on mobile devices. Bookmap is a desktop application that requires a high-performance computer and a stable internet connection. You can use Bookmap on Windows, Mac OS, or Linux operating systems.
Does Bookmap work with options?
No, Bookmap does not work with options. Bookmap works with stocks and futures only. Bookmap displays the order flow data for these instruments using heatmap, volume dots, volume bars, and indicators.
How much is Bookmap monthly?
Bookmap has two pricing options: you can subscribe to Bookmap directly through thinkorswim for $39.99 per month, or you can subscribe to Bookmap directly from its website for $16 to $99 per month. You can also try both options for free before subscribing. Bookmap offers a free trial for its website version, while thinkorswim offers a demo version for its platform version to use with mini ES futures, AAPL, and MSFT.