thinkorswim MACD: How to Use & Add It to Your Chart
The MACD (moving average convergence/divergence) is a popular technical indicator that can help you identify and follow the trends of a security.
In this article, you will learn how to add the MACD to your thinkorswim chart, how to read the MACD signals, and how to combine the MACD with another indicator, the RSI (relative strength index).
How to Add MACD to thinkorswim Chart
Adding the MACD to your thinkorswim chart is easy. Just follow these steps:
Open the chart tab on thinkorswim and select the security you want to analyze.
Click the beaker icon on the top right corner of the chart to edit studies.
Type in MACD in the search box and select MACD from the list of studies.
Click add selected, then apply. You will see the MACD plot, its signal line, and its histogram appear at the bottom of your chart.
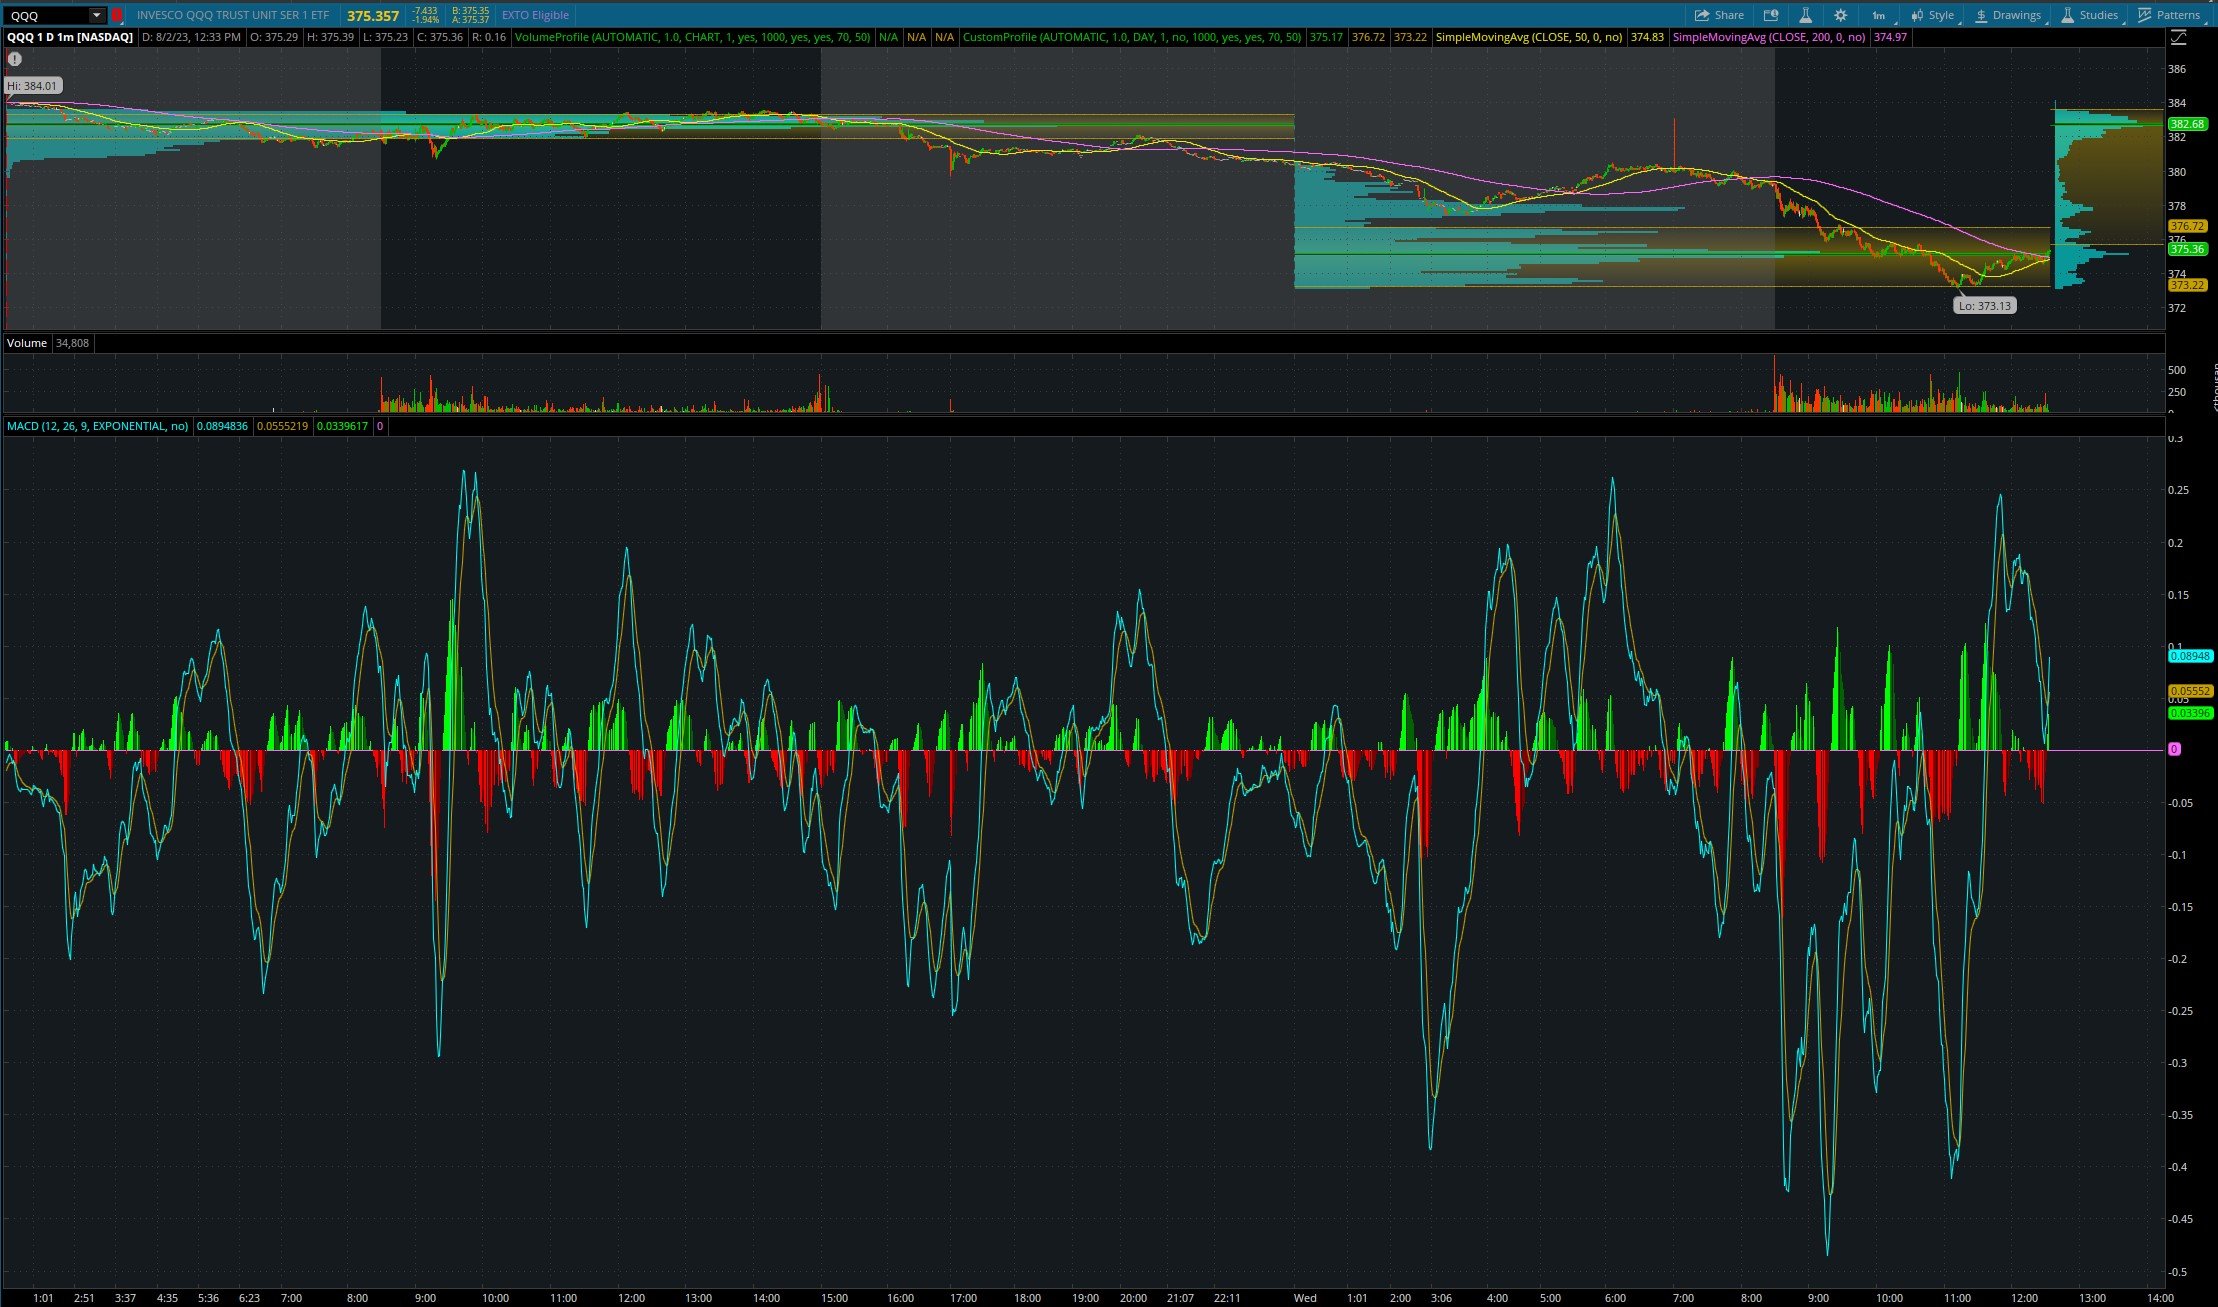
thinkorswim MACD
What is the MACD on thinkorswim
The MACD is a trend-following momentum indicator that uses two exponential moving averages (EMAs) of different periods to measure the strength and direction of a trend.
The MACD line is the result of taking the 12-period EMA and deducting the 26-period EMA from it. The signal line is another EMA, but with a 9-period setting that follows the MACD line. The histogram displays the gap between the MACD line and the signal line.
The MACD can help you identify trend changes, trend strength, and trend duration by looking at its crossovers, divergences, and slopes.
How to Read the MACD on thinkorswim
Here are some ways you can read the MACD signals on thinkorswim:
Crossovers: When the MACD line crosses above the signal line, it indicates a bullish trend change or an uptrend. When it crosses below the signal line, it indicates a bearish trend change or a downtrend.
Divergences: When the price makes a higher high or a lower low, but the MACD does not, it indicates a divergence between price and momentum. A bullish divergence occurs when the price makes a lower low, but MACD makes a higher low, suggesting a possible reversal of a downtrend. A bearish divergence occurs when the price makes a higher high, but MACD makes a lower high, suggesting a possible reversal of an uptrend.
Slopes: When the MACD line and the signal line are both rising, it indicates a strong uptrend. When they are both falling, it indicates a strong downtrend. When they are flat or close together, it indicates a weak or sideways trend.
How to Put RSI and MACD Together on thinkorswim?
The RSI (relative strength index) is another technical indicator on thinkorswim that measures the speed and magnitude of price movements. It ranges from 0 to 100 and indicates overbought or oversold conditions when it reaches above 70 or below 30 respectively.
You can put the RSI and MACD together on thinkorswim to get more confirmation of trend changes and divergences. Here is how you can do that:
Follow the steps above to add the MACD to your chart.
Click the beaker icon again to bring up the studies window.
Type in RSI in the search box and select RSI from the list of studies.
Click add selected, then apply.
Use the arrows on the right side of the indicator in the studies window to move the RSI into the same group as the MACD.
After doing this, you will see both indicators in one box at the bottom of your chart.

MACD and RSI in the Same Box
You can use both indicators together to look for crossovers and divergences that support each other. For example, if you see a bullish crossover on MACD and an oversold condition on RSI, it may indicate a strong buy signal.

MACD and RSI in the Same Chart
thinkorswim MACD | Bottom Line
The MACD is a versatile and powerful indicator that can help you analyze trends and momentum in any market. By adding it to your thinkorswim chart, you can enhance your trading decisions and strategies.
If you want to learn more about how to use technical analysis and indicators like MACD, join the HaiKhuu Trading community today! You will get access to exclusive content, live sessions, and a network of like-minded traders who are eager to share their insights and tips. Don’t miss this opportunity to take your trading to the next level.
