Volatility Contraction Pattern (VCP) Trading Strategy
The volatility contraction pattern (VCP) is a bullish trading strategy that can help you identify and profit from stocks that are in strong uptrends and are ready to break out to new highs.
The VCP was made famous by Mark Minervini, a US investing champion and author of several books on trading.
In this article, we will explain what the VCP is, how to identify it, and how to trade it effectively.
What is the Volatility Contraction Pattern (VCP) in the Stock Market?
The VCP is based on the idea that stocks in strong uptrends will eventually start consolidating and trading sideways as some investors exit for profit and new buyers step in.
This consolidation phase is characterized by a decrease in both price range and volume, indicating a lack of seller aggression and a contraction in volatility. The VCP can be seen as a series of tightening price bars that form lower highs and higher lows, creating a wedge or triangle pattern.
The VCP is a sign of accumulation, as the demand for the stock gradually outweighs the supply, creating a pressure cooker effect.
When the stock breaks above the upper boundary of the consolidation range, it signals a breakout and a continuation of the uptrend. The breakout is usually accompanied by a surge in volume as more buyers join the momentum and push the price higher.
How to Identify the VCP Pattern?
The VCP pattern must start with an uptrend, followed by a consolidation range caused by sellers stepping in to take profits. The consolidation range can last from a few days to a few weeks, depending on the time frame you are using.
The key feature of the VCP is that the price range and the volume both decrease during the consolidation phase, indicating a slowdown of volatility and a buildup of potential energy.
The VCP can have one or more contractions, each forming a lower high and a higher low. The more contractions the VCP has, the tighter and more explosive the breakout will be. However, the VCP should generally not have more than four contractions, as that would indicate a loss of momentum and a possible reversal.
The VCP also has a pivot point, which is the highest point of the consolidation range. The pivot point acts as a resistance level that the stock needs to overcome to confirm the breakout. The pivot point can be the high of the first contraction or the high of any subsequent contraction that is higher than the previous one.
VCP Pattern Example
VCP Example on tastytrade
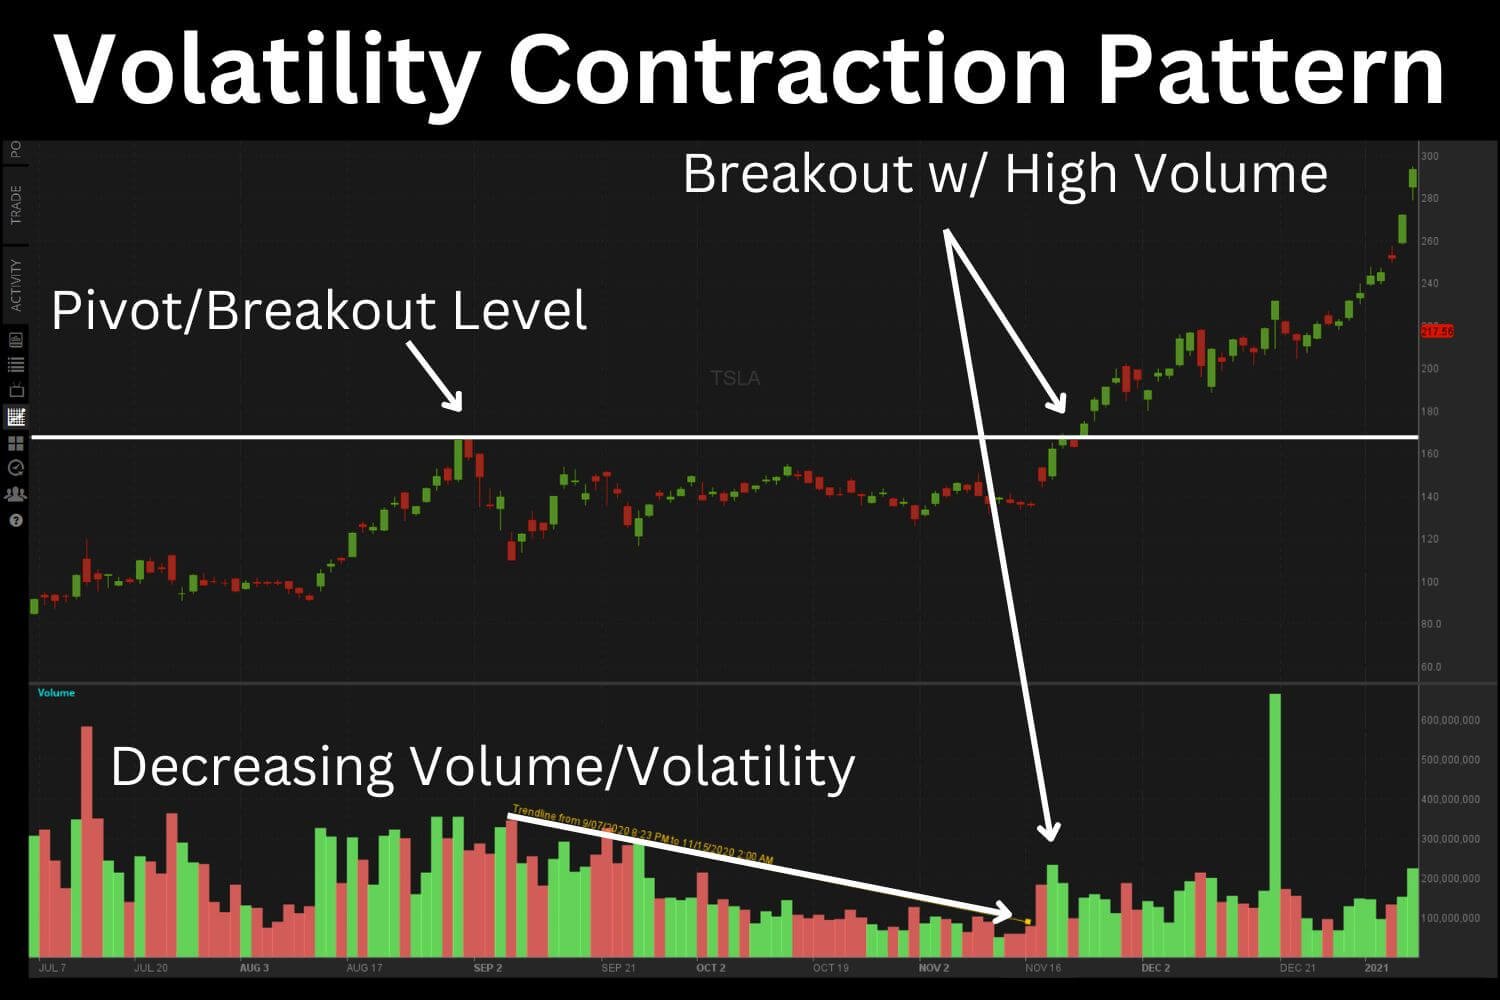
A great example of the VCP pattern is on TSLA stock from late 2020 to early 2021. On September 1st, 2020, TSLA’s uptrend ended, as the price began to drop and consolidate, and simultaneously, volume decreased, indicating the start of the VCP.
On November 19th, 2020, TSLA reached its pivot point, as the price got near the high of the first contraction. As the price approached the pivot point, the volume increased dramatically, indicating that there was a high chance of the pattern playing out.
As you can see in the chart below, the pattern did play out, and the price broke above the pivot point on high volume, signaling a breakout and a continuation of the uptrend. The price continued higher, providing traders who entered based on the VCP a profitable trade.
When to Enter a Trade Based on the VCP Pattern
The ideal time to enter a trade based on the VCP is to buy when the price breaks above the pivot point on high volume. This indicates that the demand for the stock has overcome the supply and that the stock is ready to resume its uptrend. The breakout should be decisive and clear, not choppy or hesitant.
However, not every breakout is genuine, and sometimes, the price can fall back below the pivot point, creating a false breakout or a fakeout. To avoid getting caught in a fakeout, you should consider using a stop loss below the pivot point or wait for the price to close above the pivot point before entering.
Trading is never perfect, so it may be tricky to determine when a pattern is a fakeout or real, but using a stop loss can help you limit your losses and protect your capital.
VCP Pattern Target Exit
Traders should consider exiting a trade based on the VCP pattern by selling into strength or exiting when short-term support levels break. Selling into strength means selling as the stock continues higher, taking advantage of the momentum and locking in profits. You can use trailing stop losses, profit targets, or technical indicators to help you decide when to sell into strength.
Alternatively, you can wait for the stock to break support before selling, using short-term support levels such as moving averages, trend lines, or the Ichimoku cloud indicator. These support levels can help you identify when the uptrend is weakening or reversing and when it is time to exit the trade.
VCP Risk Management Strategy
If the stock breaks back under the pivot point and fails to break out, you should set an alert or a stop loss below it to ensure you don’t get caught in a fake-out VCP. The pivot point is a key level that the stock should not violate if the VCP is valid.
If the stock closes below the pivot point, it means that the breakout has failed and that the pattern is invalidated. You should exit the trade as soon as possible and look for another opportunity.
How to Learn More About Technical Analysis
The VCP pattern is one of the many technical analysis patterns that can help you improve your trading performance and profitability. If you want to learn more about technical analysis and trading, you should join the HaiKhuu Trading Community.
The HaiKhuu Trading Community is a free and friendly platform where you can access daily morning reports, live trading calls, and a supportive community of like-minded traders who are willing to help you learn.
